Kmeans clustering is a machine learning algorithm often used in unsupervised learning for clustering problems.
It is a method that calculates the Euclidean distance to split observations into k clusters in which each observation is attributed to the cluster with the nearest mean (cluster centroid).
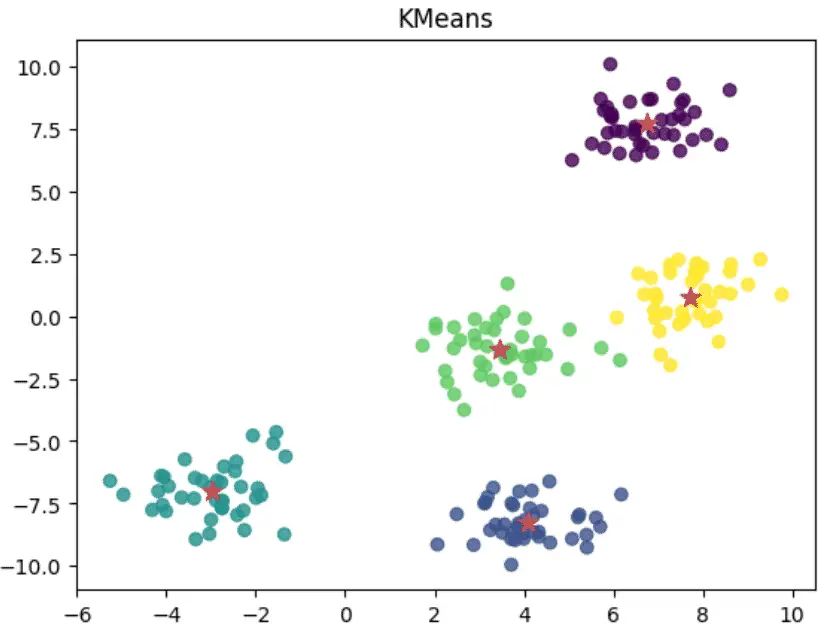
In this tutorial, we will learn how the KMeans clustering algorithm works and how to use Python and Scikit-learn to run the model and classify data as in the example below.
Finally, I will provide a cheat sheet that will help you remember how the algorithm works at the end of the article.
Navigation
Show
How does KMeans clustering algorithm work?
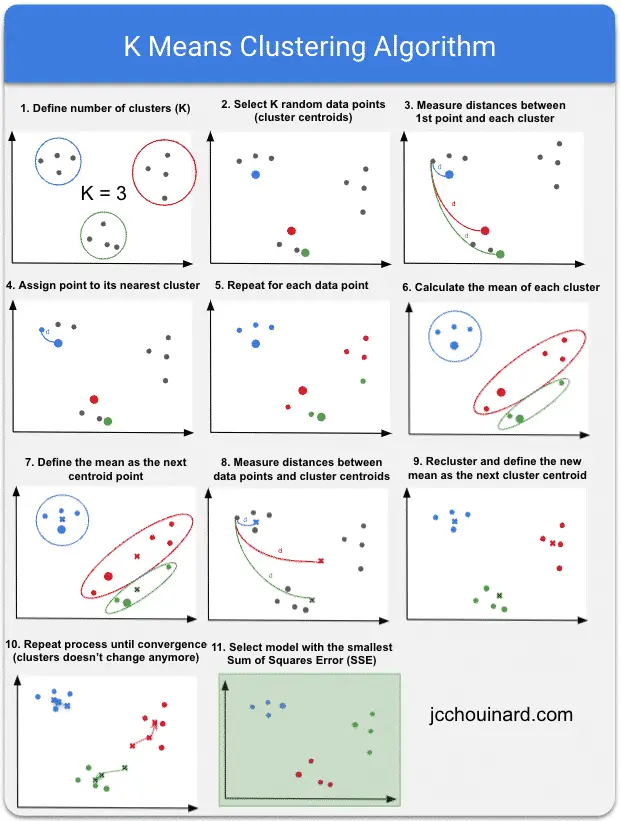
The KMeans clustering algorithm works in multiple steps that are very well explained by Siraj Raval.
- Select the number of clusters (K)
- Randomly select a number of data points that matches the number of clusters
- Measure the distances between each point to its initial cluster
- Assign each datapoint to its nearest initial cluster
- Repeat the calculations for each point
- Calculate the mean of each cluster
- Assign the mean as the new cluster centroid
- Measure each point to the new cluster centroid
- Redefine clusters and assign the new mean as the next cluster centroid
- Repeat process until convergence
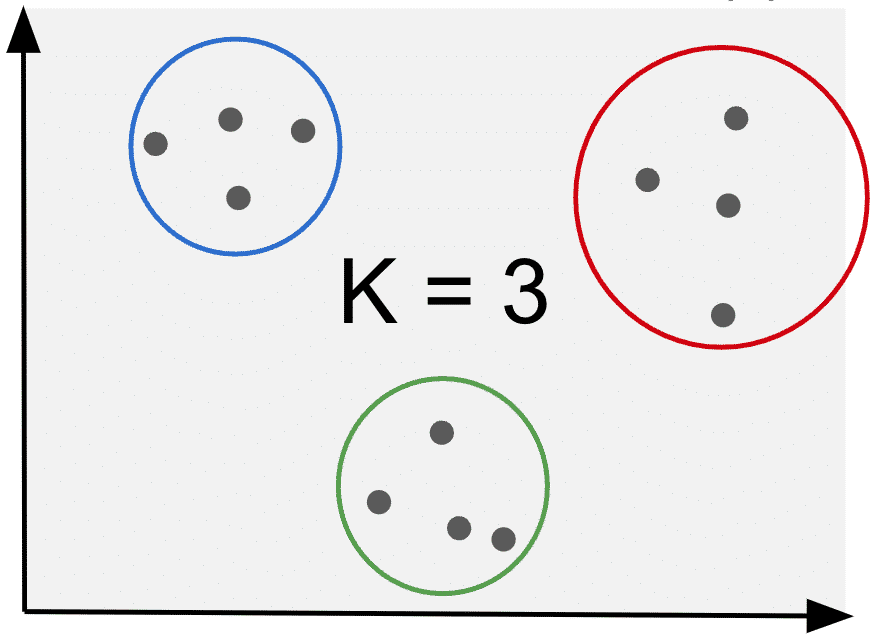
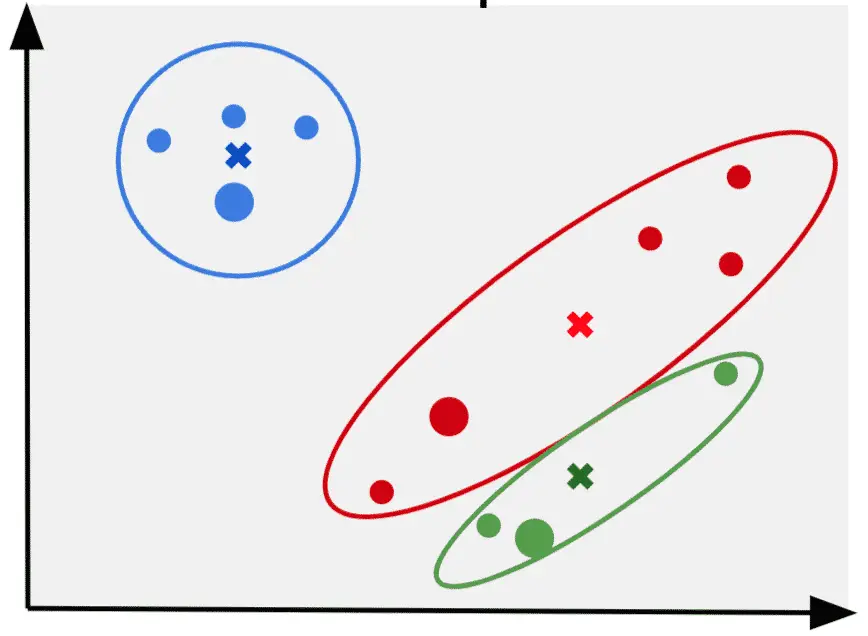
1. Select the number of clusters (K)
In KMeans clustering, the number of clusters (K) needs to be defined.
This is the “K” in “K-Means clustering”.
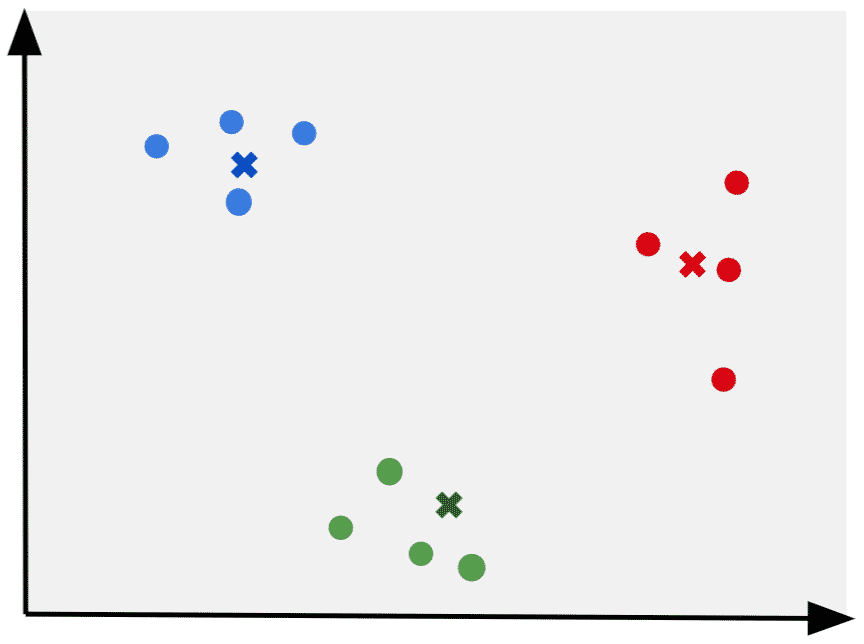
Below is an example where we can clearly see 3 clusters in the data. In this case K=3.
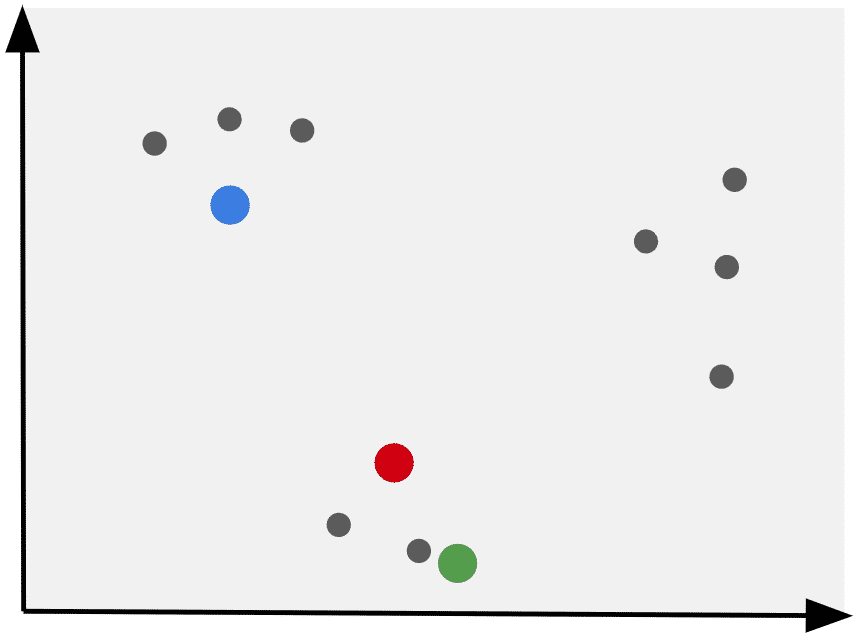
2. Randomly select a number of data points that matches the number of clusters
The KMeans algorithm will select a number of random data points that match the value of K (number of clusters).
These will become the initial clusters (cluster centroids).
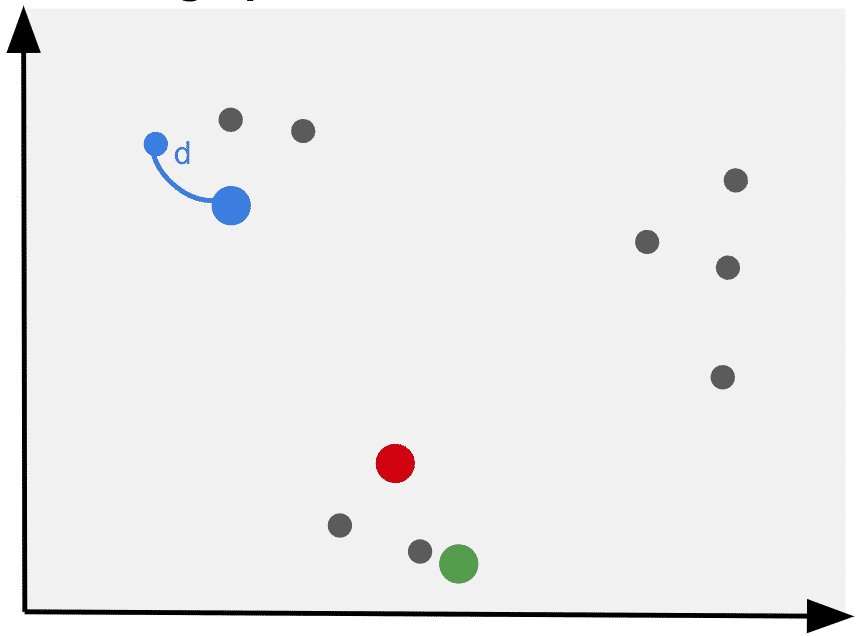
3. Measure the distances between each point to its initial cluster
The clustering algorithm calculates the Euclidean distances between each point to each cluster point.
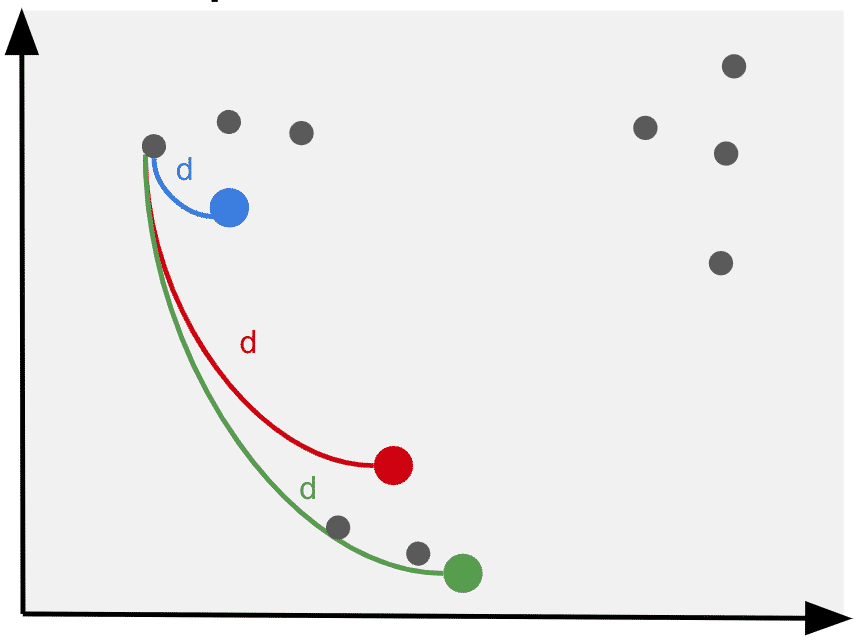
In KMeans, the euclidean distance between all points to the centroid is calculated by measuring the distances of the Y and X coordinates to the centroid. By squaring the results we calculate the.
For example, for a point A (1,2) and a centroid C (3,4), the euclidean distance is given with the formula s = (1–3)² + (2–4)².
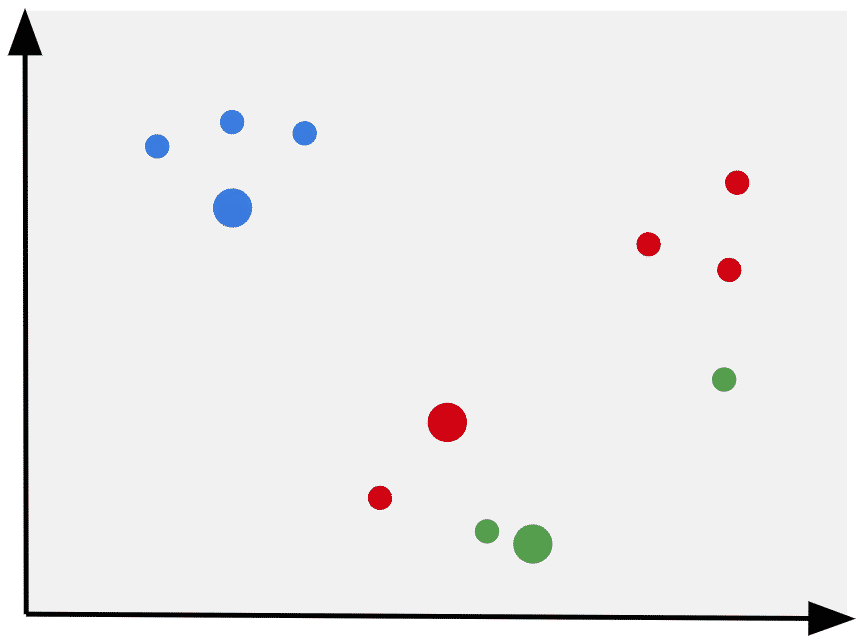
4. Assign each datapoint to its nearest initial cluster
Assign the first point to the closest initial cluster.
5. Repeat the calculations for each point
6. Calculate the mean of each cluster
The next step is to add all the data points in each cluster and divide them by the number of points in the cluster, essentially calculating the mean of the cluster.
Hence the “mean” in “K-Means”.
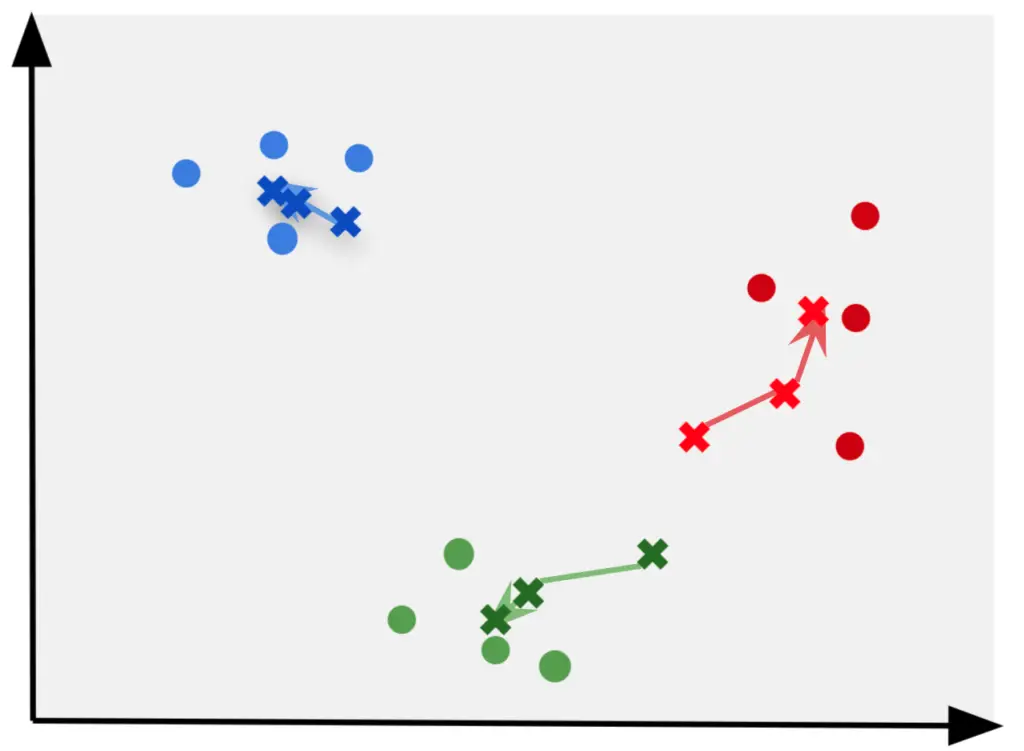
7. Assing the mean as the new cluster centroid
Then, the mean is selected as the next cluster centroid.
8. Measure each point to the new cluster centroid
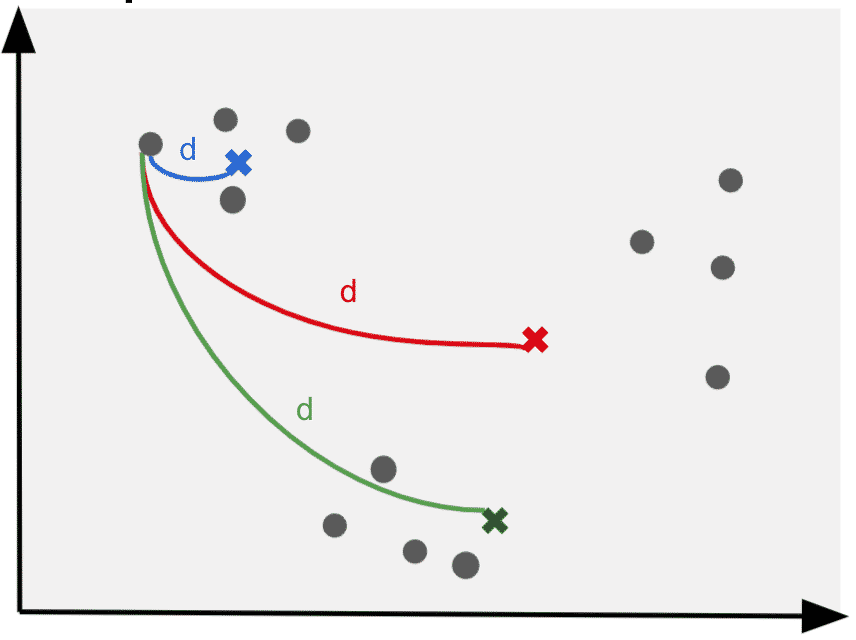
9. Redefine clusters and assign the new mean as the next cluster centroid
10. Repeat process until convergence
Repeat the process until the clusters do not change anymore.
It is also possible to define a maximum number of iterations on large datasets to reduce computational resources.
11. Select the parameters with the smallest SSE
The goal of machine learning clustering algorithms is to find clusters that minimize errors. In the case of KMeans, the error is often calculated with the Sum of Squares Errors (or SSE).
How to use the right number of clusters (K)?
The optimal number of clusters generally equals the number of classes. If you know that number of classes, use it as your number of clusters.
For example, if you know that you are clustering webpages into 5 different categories, you can use 5 as your number of clusters.
Otherwise, if you don’t know the number of classes, you can use the Elbow method to define the number of clusters.
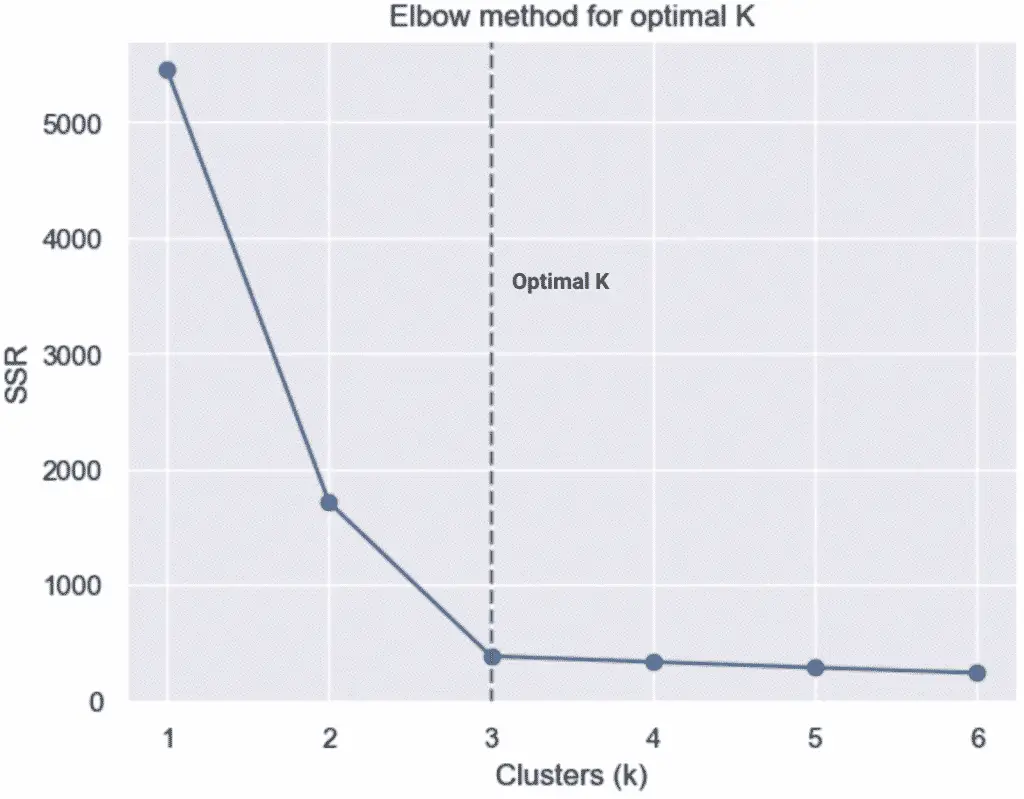
The Elbow Method
The elbow method is used in cluster analysis to help determine the optimal number of clusters in a dataset.
It works by:
- defining a range of K values to run K-Means clustering on
- evaluating the Sum of Squares Errors (SSE) for the model using each of the defined numbers of clusters.
The optimal K value is usually found at the “elbow” where the curve starts to become more constant.
Rules of the Elbow Method
- The maximum of clusters you can have is equal to the number of individual points.
- When the number of clusters equals the number of points, the distortion (sum of squared distances) equals 0.
- More clusters involve more computation costs.
Alternatives to the Elbow Plot
When the data is evenly distributed, the elbow method does not clearly define the optimal K.
You can also choose the best K value programmatically or by using the silhouette coefficient, or alternatively by using gap statistics.
What is the Meaning of KMeans Inertia (Sum of Squares Errors)
KMeans inertia, also known as Sum of Squares Errors (or SSE), calculates the sum of the distances of all points within a cluster from the centroid of the point.
It is the difference between the observed value and the predicted value. It is calculated using the sum of the values minus the means, squared.
(point_1 - mean)^2 + (point_2 - mean)^2 + (point_N - mean)^2
The sum of squares errors will often tak different names:
- Inertia (Scikit-learn)
- Distortion (SciPy)
When to use KMeans?
KMeans is best suited for:
- Unsupervised learning problems
- With numeric data, does not work on categorical data
- Better suited for linear datasets
Advantages
- simple
- fast computation
Disadvantages
- need to define the clusters
- hard time handling outliers
- fail on non-linear datasets
- biased towards equal sized clusters
- seeds impact clustering results (e.g.
np.random.seed())
Alternatively, you could use DBSCAN or Hierarchical clustering.
What if KMeans Fail?
KMeans can perform poorly when the shape of the clusters are not round, equally sized /dense or when there are a lot of outliers.
In which case, we can use HDBSCAN clustering algorithm and embedding for document comparison. HDBSCAN will understand the semantic meaning to help cluster the documents.
KMeans Clustering with Python and Scikit-learn
For the rest of this article, we will perform KMeans clustering using Scikit-learn.
We will:
- Create dummy data for clustering
- Train and cluster data using KMeans
- Plot the clustered data
- Pick the best value for K using the Elbow method.
Create dummy data for clustering
First, we’ll create the dataset using make_blobs.
from sklearn.datasets import make_blobs

# create a dataset of 200 samples
# and 5 clusters
features, labels = make_blobs(
    n_samples=200,
    centers=5
)
Train and cluster data using KMeans
Next, we will train the model using 5 clusters and limit it to 10 iterations with different centroid seeds.
from sklearn.cluster import KMeans

# Instanciate the model with 5 'K' clusters
# and 10 iterations with different
# centroid seed
model = KMeans(
    n_clusters=5,
    n_init=10,
    random_state=42
    )

# train the model
model.fit(features)

# make a prediction on the data
p_labels = model.predict(features)
Plot the clustered data
Then, we’ll use matplotlib to plot the KMeans scatter plots and the cluster centroids.
import matplotlib.pyplot as plt
plt.style.use('default')

X = features[:,0]
y = features[:,1]

plt.scatter(X, y, c=p_labels, alpha=0.8)

cluster_centers = model.cluster_centers_
cs_x = cluster_centers[:,0]
cs_y = cluster_centers[:,1]

plt.scatter(cs_x, cs_y, marker='*', s=100, c='r')
plt.title('KMeans')
plt.show()
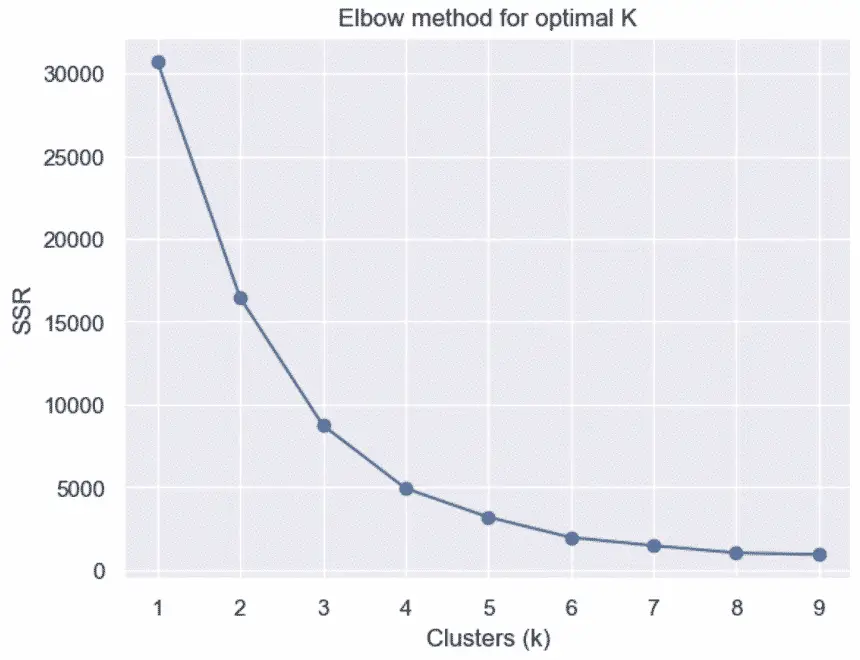
Pick the best value for K (kmeans.inertia_)
Finally, we will plot the elbow method graph to see if we have chosen the best cluster number.
We already know the answer is yes in this case because we selected the number of clusters based on the data we generated.
Here, Seaborn is optional. It is used to define the style of the plot.
import matplotlib.pyplot as plt
import seaborn as sns
sns.set()

ks = range(1, 10)

ssr = []
# For each cluster K
for k in ks:
    # create model instance of K clusters
    model = KMeans(n_clusters=k)

    # fit the model
    model.fit(features)

    # append the inertial to a list
    ssr.append(model.inertia_)

# Plot
plt.plot(ks, ssr, '-o')
plt.xlabel('Clusters (k)')
plt.ylabel('SSR')
plt.xticks(ks)
plt.title('Elbow method for optimal K')
plt.axvline(x=5,linestyle='--',c='grey')
plt.show()
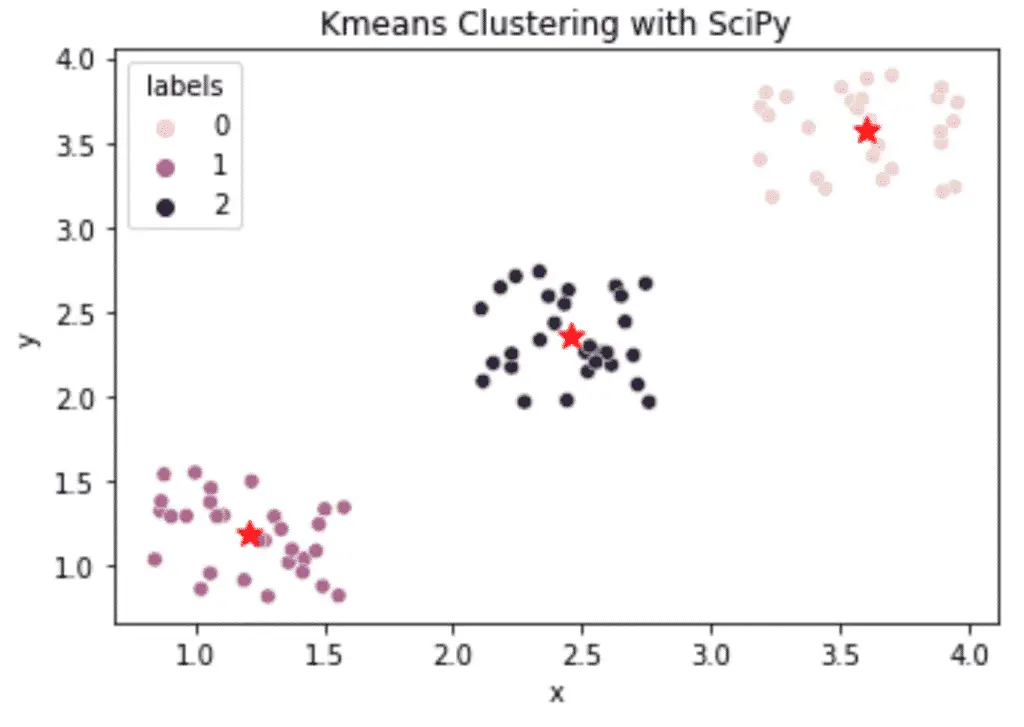
KMeans Clustering with SciPy
Scikit Learn is not the only machine learning library capable of running the Kmeans algorithm.
Below is an example of how you can run the KMeans algorithm in SciPy.
The result is stored in a Pandas DataFrame and plotted using Python’s Seaborn library.
import matplotlib.pyplot as plt
from numpy import vstack,array
from numpy.random import rand
import pandas as pd
import seaborn as sns

from scipy.cluster.vq import kmeans,vq,whiten

# Generate data
data = vstack((
    (rand(30,2)+1),(rand(30,2)+2.5),(rand(30,2)+4)
    ))

# standardize the features
data = whiten(data)

# Run KMeans  with 3 clusters
centroids, _ = kmeans(data, 3)

# Predict labels
labels, _ = vq(
    data, centroids
)

# Create DataFrame
df = pd.DataFrame(data, columns=['x','y'])
df['labels'] = labels

# Plot Clusters
sns.scatterplot(
    x='x',
    y='y',
    hue='labels',
    data=df
)

# Plot cluster centers
cs_x = centroids[:,0]
cs_y = centroids[:,1]
plt.scatter(cs_x, cs_y, marker='*', s=100, c='r')

plt.title('Kmeans Clustering with SciPy')
plt.show()
KMeans Methods in Python
Based on the official documentation, here is a list of the methods that can be used on the KMeans object in Python.
| fit() | Compute k-means clustering. |
| fit_predict() | Compute cluster centers and predict cluster index for each sample. |
| fit_transform() | Compute clustering and transform X to cluster-distance space. |
| get_feature_names_out() | Get output feature names for transformation. |
| get_params() | Get parameters for this estimator. |
| predict() | Predict the closest cluster each sample in X belongs to. |
| score() | Opposite of the value of X on the K-means objective. |
| set_params() | Set the parameters of this estimator. |
| transform() | Transform X to a cluster-distance space. |
KMeans Algorithm Cheat Sheet
Machine Learning Projects with KMeans
Other insteresting work in the community
- The Most Comprehensive Guide to K-Means Clustering You’ll Ever Need (by Pulkit Sharma)
- K-Means Clustering Explained with Python Example (by Ajitesh Shukla)
- K-Means Clustering – The Math of Intelligence (by Siraj Raval)
- K-Means Clustering in Python: A Practical Guide (by Kevin Arvai)
- K-Means clustering on the MNist dataset (by John Loeber)
- What is K-means clustering? (Plus free Python code) (by Robin Lord)
- Discover Interlinking Opportunities using K-Means and Python (by Greg Bernhardt)
KMeans FAQ
Is KMeans clustering supervised or unsupervised?
K-Means is an unsupervised learning algorithm. It is unsupervised because the points have no external labels.
What KMeans Does?
KMeans is a clustering algorithm that assign groups to a dataset without the need for previously labelled data.
Which is better: KNN or KMeans?
Depending on the data that you have available either one may be a better model. The difference lies in the fact that KNN (K-Nearest Neighbor) is a supervised learning algorithm (requires labelled data) used in classification tasks and KMeans is an unsupervised learning algorithm (no label required) used in Clustering tasks.
How does KMeans Work?
KMeans uses a technique that uses Euclidean distance and the mean of selected datapoints to be the cluster centroid, moving the centroid along with the new mean until convergence.
What is a good real life example of KMeans Clustering?
KMeans Clustering is used in various applications such as document clustering in Information Retrieval and SEO, customer segmentation, recommender systems on web platforms, pattern recognition. It is often used in Marketing to improve user experience or draw insights from data.
Which is Better for KMeans: SciPy or Sklearn?
One of the reason user may prefer Sklearn over SciPy is that it has a better documentation and more tools (e.g. GridsearchCV). In the case of the specific use of KMeans, SKlearn’s class has more parameters than SciPy. On the other end, SciPy allows to set the centroids.
What does the Euclidean Distance mean in KMeans?
The Euclidean distance between to points is the length of a line between two points.
KMeans Clustering
| Term K-Means was coined by | James MacQueen |
| Popular KMeans algorithm | Naïve k-means |
| Kmeans applications | Vector quantization, clustering, feature learning |
| KMeans Libraries in Python | Sklearn, Scipy |
| Type of machine learning | Unsupervised learning |
Conclusion
We have covered quite a lot in this article. We now know what KMeans clustering is and how the algorithm works. We also know how to cluster numeric data with Scikit-learn.

SEO Strategist at Tripadvisor, ex- Seek (Melbourne, Australia). Specialized in technical SEO. Writer in Python, Information Retrieval, SEO and machine learning. Guest author at SearchEngineJournal, SearchEngineLand and OnCrawl.