Hierarchical clustering is a machine learning algorithm often used in unsupervised learning for clustering problems.
In this tutorial, we will learn how the hierarchical clustering algorithms work and how to use Python and SciPy to group data into clusters as in the example below.
What is Hierarchical Clustering?
Hierarchical clustering, also known as hierarchical cluster analysis, is an unsupervised learning algorithm used to group similar objects into clusters.
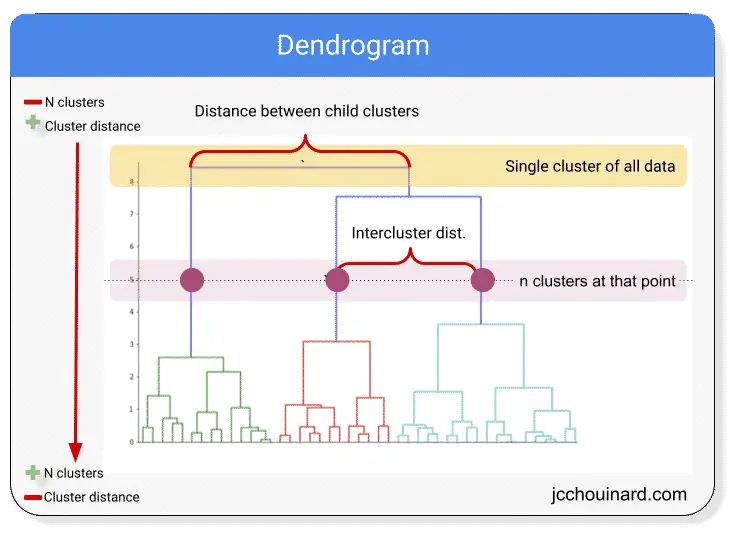
The image above shows a dendrogram.
The dendrogram can be used to visualize hierarchical clustering.
The algorithm starts by assigning 1 cluster for each data point (bottom of the graph).
It then merges the closest clusters at each iteration and ends with a single cluster for the entire dataset.
Pros and Cons of hierarchical clustering
Advantages
Can help for the discovery of the optimal number of clusters.
Insightful and interpretable data visualization
Disadvantages
Not scalable as runtime increases with the number of data points. Kmeans is significantly faster on large datasets.
How does Hierarchical Clustering Work?
Hierarchical clustering algorithms work by starting with 1 cluster per data point and merging the clusters together until the optimal clustering is met.
- Having 1 cluster for each data point
- Defining new cluster centers using the mean of X and Y coordinates
- Combining clusters centers closest to each other
- Finding new cluster centers based on the mean
- Repeating until optimal number of clusters is met
Hierarchical Clustering in SciPy
One common algorithm used for hierarchical cluster analysis is hierarchy from the scipy.cluster SciPy library.
For hierarchical clustering in SciPy, we will use:
- the
linkagemethod to create the clusters - the
fclustermethod to predict the labels
linkage
The linkage method is used to create the clusters and is accessible here: scipy.cluster.hierarchy.linkage
# create clusters
linkage(
    y,
    method='',
    metric=''
    )
- The input
ymay be either a 1-D condensed distance matrix or a 2-D array of observation vectors. methodis used to define the statistical model to use to calculate the proximity of clustersmetricis the distance between two objects.
fcluster
The fcluster method is used to predict labels on the data and is accessible here: scipy.cluster.hierarchy.fcluster
# Predict cluster labels
fcluster(
    matrix,
    n_clusters,
    criterion=''
    )
- The input is a matrix returned by the
linkagemethod. n_clustersdepends on the chosen criterioncriteriondefines how to decide the thresholds to apply
SciPy Hierarchical cluster analysis in Python
Let’s use Python to create hierarchical clusters on dummy data generated with NumPy.
Seaborn and matplotlib will be used for data visualization and Pandas to combine the arrays into a dataframe.
import matplotlib.pyplot as plt
import numpy as np
from numpy.random import rand
import pandas as pd
import seaborn as sns

from scipy.cluster.vq import whiten
from scipy.cluster.hierarchy import fcluster, linkage

# Generate initial data
data = np.vstack((
    (rand(30,2)+1),
    (rand(30,2)+2.5),
    (rand(30,2)+4)
    ))

# standardize (normalize) the features
data = whiten(data)

# Compute the distance matrix
matrix = linkage(
    data,
    method='ward',
    metric='euclidean'
    )

# Assign cluster labels
labels = fcluster(
    matrix, 3,
    criterion='maxclust'
    )

# Create DataFrame
df = pd.DataFrame(data, columns=['x','y'])
df['labels'] = labels

# Plot Clusters
sns.scatterplot(
    x='x',
    y='y',
    hue='labels',
    data=df
)

plt.title('Hierachical Clustering with SciPy')
plt.show()
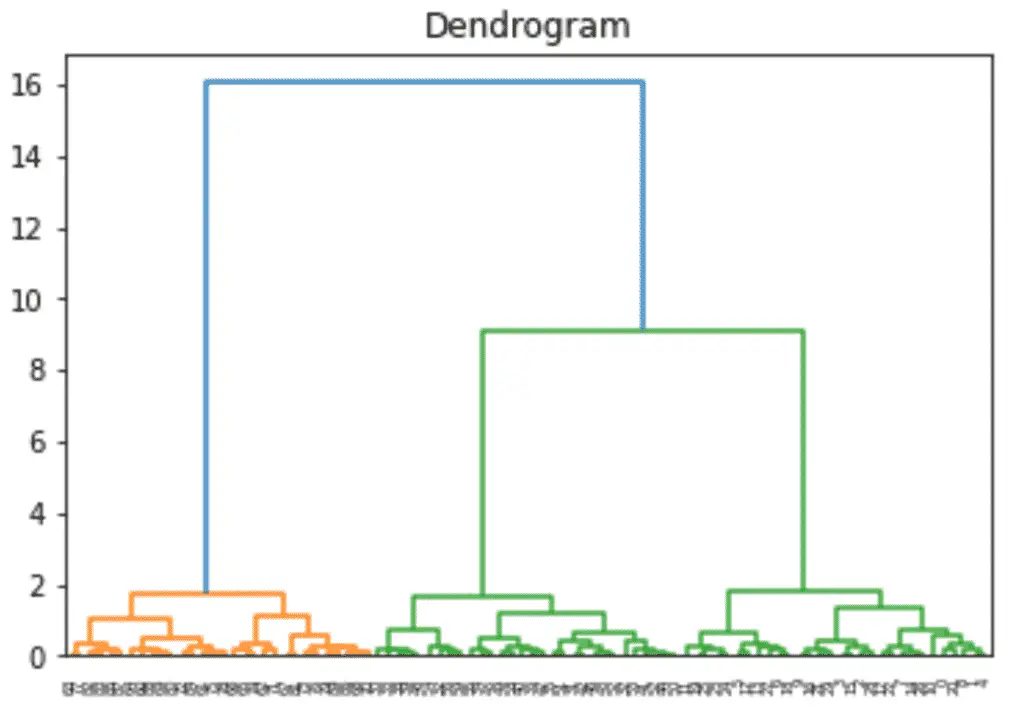
Build a Dendrogram
from scipy.cluster.hierarchy import dendrogram

dn = dendrogram(matrix)
plt.title('Dendrogram')
plt.show()
Interesting posts in the community
- Social Network Analysis through Hierarchical Clustering by Maksim Tsvetovat and Alexander Kouznetsov
- Document Clustering with Python by Brandon Rose
- Customer-segmentation for differentiated targeting in marketing using clustering analysis by Debayan Mitra
- K-Means clustering and hierarchical document clustering on the most popular Tweets of US congresspeople by Noah Segal-Gould and Tanner Cohan
Conclusion
We have now covered how hierarchical clustering works and how to group data into clusters using Python and SciPy.
It is an interesting way to cluster data into classes but has some pitfalls. I suggest that you read how to use the K-Means algorithms in Python when dealing with larger datasets.

SEO Strategist at Tripadvisor, ex- Seek (Melbourne, Australia). Specialized in technical SEO. Writer in Python, Information Retrieval, SEO and machine learning. Guest author at SearchEngineJournal, SearchEngineLand and OnCrawl.