Regression in machine learning is a supervised learning approach in which computer programs try to make predictions on continuous variables.
Simply put, the goal of the regression algorithm is to plot a best-fit line (or curve) between dependent (target) and independent (feature/predictor) variables.
What is Regression Analysis?
Regression analysis is a method of prediction that describes the relationship between variables.
It is used when there is a cause to effect relationship between variables.
Regression allows predicting how a dependent variable will change as the independent variable(s) change.
Example: Ice cream sales are impacted by temperature rises.
Finding the Best Line
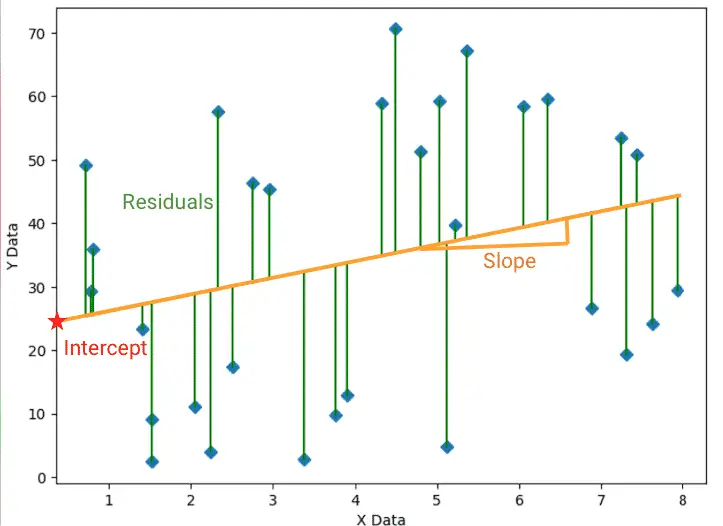
Regression analysis tries to fit a line (or curve) in a scatter plot of two continuous variables in a way that the data points lie collectively as close as possible to the line.
Below is an example of a linear regression where the intercept and the slope of the line are positioned in a way that minimizes the sum of the residuals.
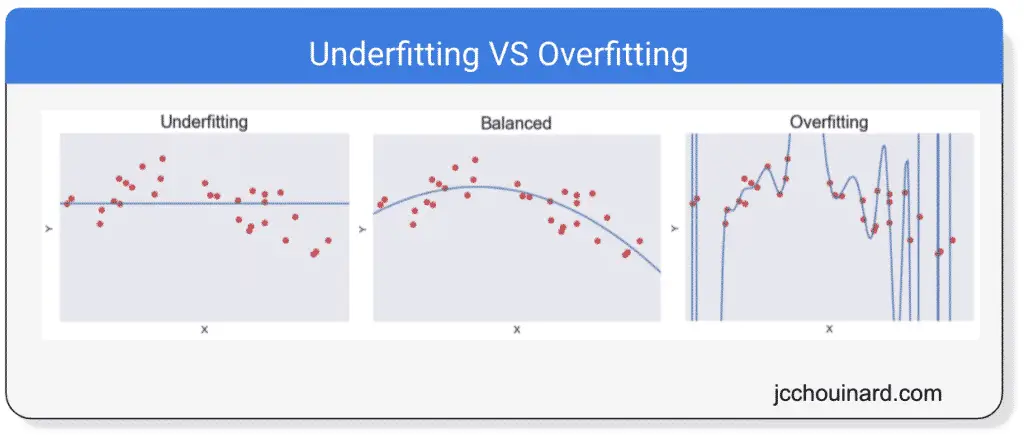
Overfitting and Underfitting
- underfitting: model is too simple.
- overfitting: model is too complicated.
Types of regression algorithms
- Linear Regression
- Ridge Regression
- Lasso Regression
- Logistic Regression
- Polynomial Regression
- Decision Tree Regression
- Support Vector Regression
- Random Forest Regression
Linear Regression
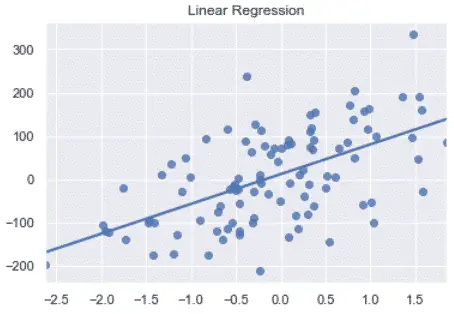
Linear regression analysis is most commonly used for predictive analysis.
The objective of linear regression is to fit a line in a scatter plot of two continuous variables in a way that the data points lie collectively as close as possible to the line.
It is estimated using the Ordinary Least Squares (OLS) approach.
Formula of the linear Regression
y = ax + b
yis the coordinates of the dependent variable (also known as response or target variable)xis the coordinates of the independent variableais the slope of the linebis the intercept wherexmeetsy
Types of linear regressions
- Simple linear regression
- Multiple linear regression
Ridge Regression
The Ridge Regression is a regularization method that extends the linear regression by adding penalties to the loss function.
This method performs L2 regularization in order to reduce the overfitting of the OLS approach.
The L2 penalty minimizes the sizes of the coefficients that don’t contribute a lot to a prediction task without removing them.
Lasso Regression
The Lasso Regression is a regularization method that extends the linear regression by adding penalties to the loss function.
This method performs L1 regularization in order to reduce the overfitting of the OLS approach.
The L1 penalty minimizes the sizes of the coefficients that don’t contribute a lot to a prediction task and allow their removal.
In other words, the L1 regularization selects the most important features for the prediction and discards the less important features.
Logistic Regression
The logistic regression can be used for classification problems.
In logistic regression, the predicted value will be given from the highest probability of getting that value.
It is estimated using the Maximum Likelihood Estimation (MLE) approach.
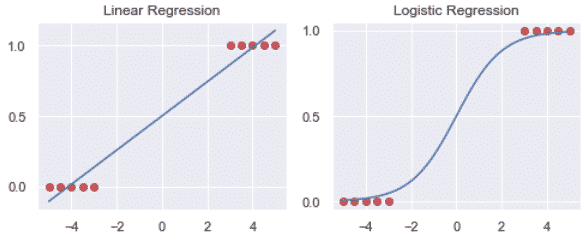
We can see above how the logistic regression may be a better fit to the data than the linear regression.
Some logistic regression algorithms are:
LogisticRegressioninsklearn.linear_model
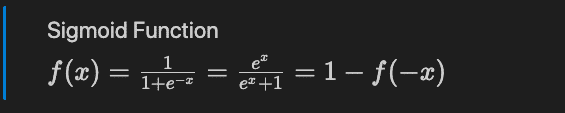
Formula of the logistic regression
The logistic regression is based on the sigmoid mathematical function.
Types of logistic regressions
- Binary logistic regression
- Multinomial logistic regression
- Ordinal logistic regression
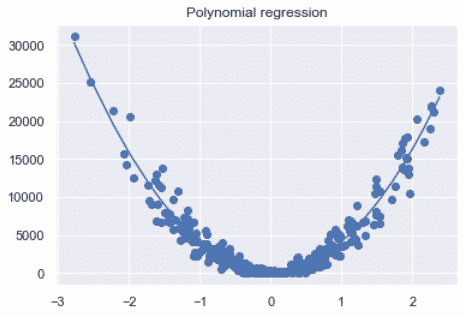
Polynomial Regression
Polynomial regression is a type of regression that models non-linear data using a linear model.
It fits a non-linear curve to the data by transforming the original features into polynomial features and then applying linear regression to it.
It is estimated using the least-squares approach.
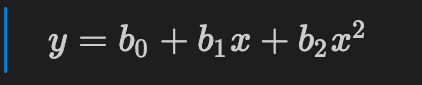
Formula of a Polynomial Regression
Support Vector Regression (SVR)
The support vector regression (SVR) is a statistical method that uses the principles of Support Vector Machine (SVM) algorithms to examine the linear relationship between two continuous variables.
Support vector machines can be used for regression and classification problems. When they are used for regression problems, it is called support vector regression.
It is estimated using the kernel methods.
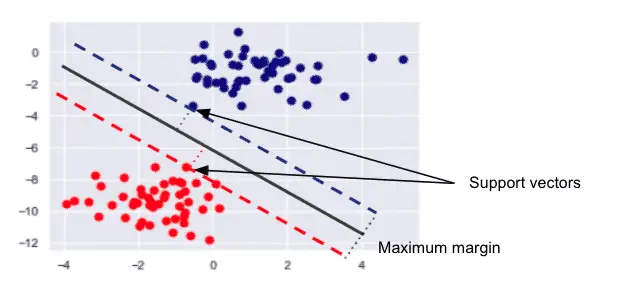
Support Vector Machine (SVM) Algorithm Hyperparameters
- Support vectors: Support vectors are chosen in a way that they are at a maximum distance from the hyperplane. They are defined using the closest data points from the hyperplane in both classes.
- Kernel: Method used to apply linear classifiers to nonlinear problems by mapping non-linear data from low-dimensional space into a higher-dimensional space. There are different kernels such as: Sigmoid Kernel, Polynomial Kernel, Gaussian Kernel.
- Hyperplane: The hyperplane is the separation line distinctly classifies the data points in N-dimensional space.
- Boundary line: Boundary lines defined by support vectors are the 2 lines that classify the data points above and below the hyperplane. The SVM tries to make a decision boundary so that the separation between the two classes is as wide as possible. Any point in our dataset that falls inside the boundary lines is disregarded as a margin of error.
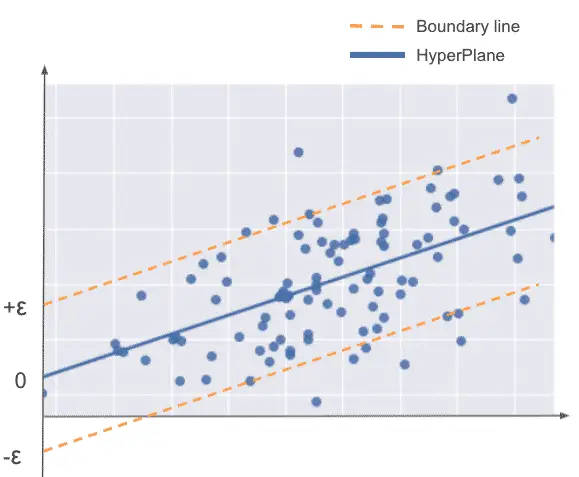
Epsilon (ε) is the regularizer and is used to define the margins of error.
Some SVM regression algorithms are:
SVRfromsklearn.svm
Decision Tree Regression
The decision tree regression is based on the decision tree algorithm.
Decision trees are predictive models that use simple binary rules to predict the value of a target variable.
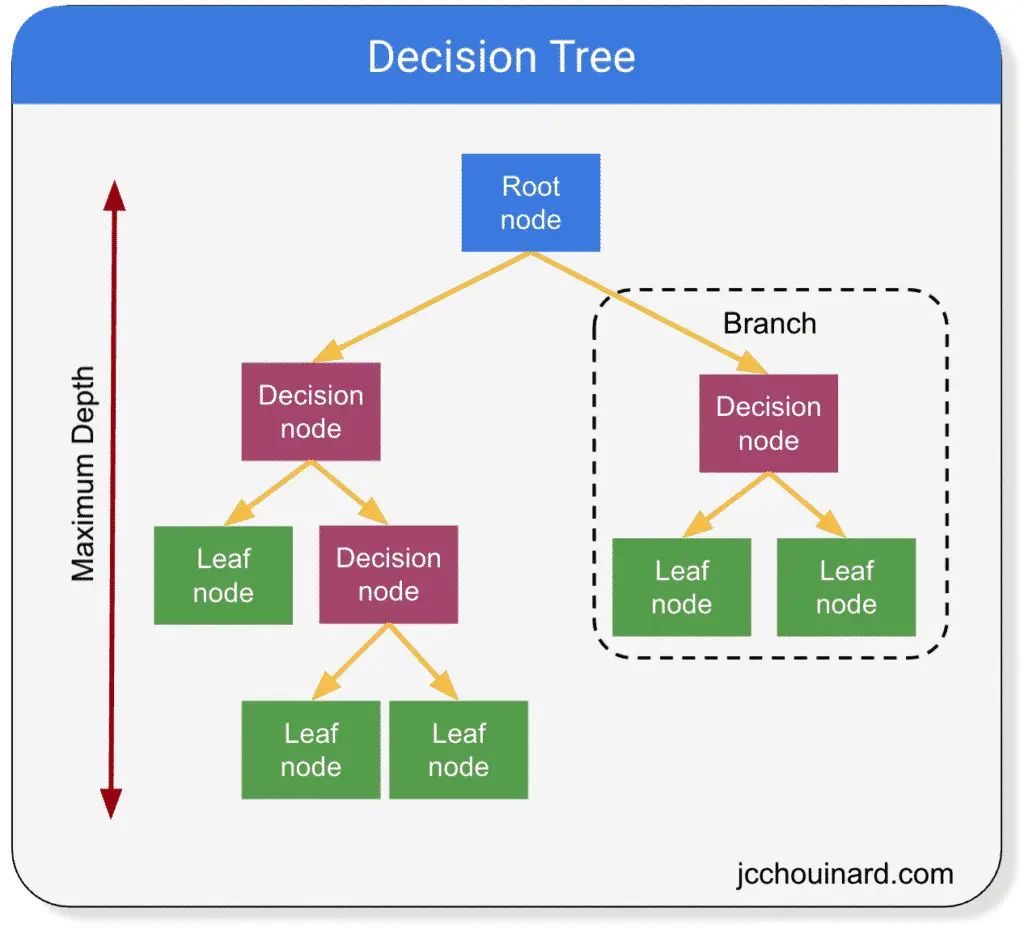
Decision trees can be used for both classification and regression.
They are simple models that have branches, nodes and leaves and break down a dataset into smaller subsets containing instances with similar values. The decision tree will fit a sine curve to the data to define the rules of the classification or the regression.
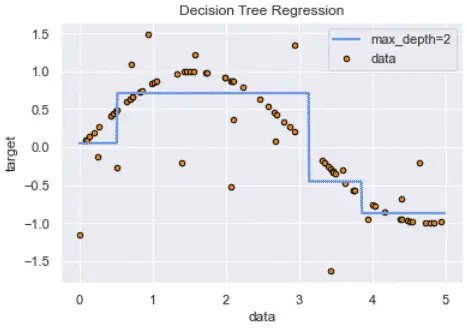
However, decision trees can overfit the model by interpreting too granular details from training data depending on the chosen hyperparameters.
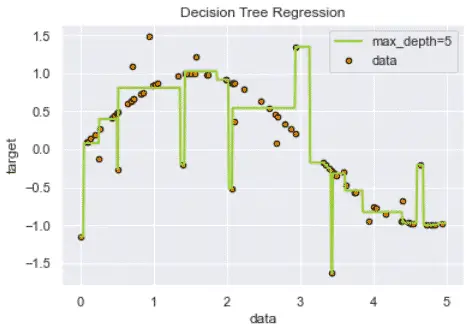
This overfitting can be minimized using the random forest regression instead.
Some decision trees regression algorithms are:
DecisionTreeRegressorinsklearn.tree
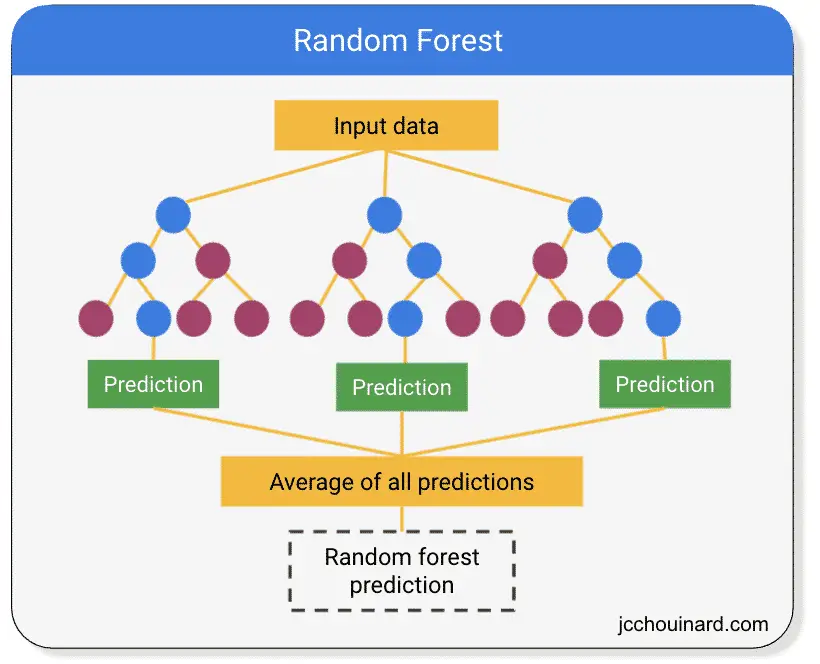
Random Forest Regression
The random forest regression is a simple and highly accurate machine learning algorithm that calculates the average prediction of multiple decision trees.
Random forest is both a supervised learning algorithm and an ensemble algorithm.
Random forest takes in the n_estimators hyperparameter to define the number of decision trees to generate for the model.
Some Random Forests regression algorithms are:
RandomForestRegressorfromsklearn.ensemble
Common Regression Metrics
- Mean Squared Error (MSE)
- Root mean squared error (RMSE)
- Mean absolute error (MAE)
Make a regression with Scikit-learn
In the next tutorial, we will use Python to make a machine learning LogisticRegression project with Sciki-learn on online shoppers intentions.
We will cover:
- Exploratory data analysis (EDA)
- Data preprocessing
- Hyperparameter tuning
- Model evaluation
- Evaluate feature importance
Conclusion
We have seen an overview of regression analysis and covered the basic regression algorithms. Next, we will look at classification in Machine learning.

SEO Strategist at Tripadvisor, ex- Seek (Melbourne, Australia). Specialized in technical SEO. Writer in Python, Information Retrieval, SEO and machine learning. Guest author at SearchEngineJournal, SearchEngineLand and OnCrawl.