The classification report is often used in machine learning to compute the accuracy of a classification model based on the values from the confusion matrix.
Classification Report Metrics Interpretation
The table below comes from a classification algorithm that uses the KNeighborsClassifier class from Scikit-learn to classify breast cancers (Python code below).
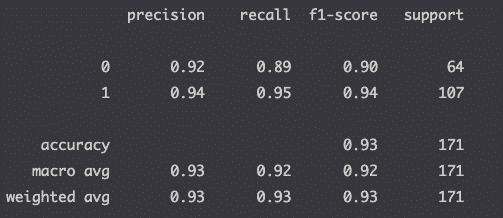
The classification report is generated using the classification_report() function from Scikit-learn’s metrics module.
from sklearn.metrics import classification_report
classification_report(y_test, y_pred)
How is Precision Calculated in Classification Report?
The precision tells us the accuracy of positive predictions.
When we predict True, how often is it really True? This number should be as high as possible.
High precision: Not many True values were predicted as False
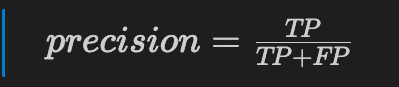
true positive / (true positive + false positive)
What is Recall?
The recall, also named sensivity, or hit rate, tells us the fraction of correctly identified positive predictions.
What fraction of the True predictions were actually True? This number should be as high as possible.
High recall: Predicted most True values correctly.

true positive / (true positive + false negative)
Note that the metrics.recall_score(actual,predicted, pos_label=0) can be used to calculate the specificity of the model .
The specificity is essentially the opposite of recall:
true negative / (true negative + false positive)
What is the f1-score?
The f1-score, or F measure, measures precision and recall at the same time by finding the harmonic mean of the two values.
This score is useful when you have opposite scores coming from precision and recall.
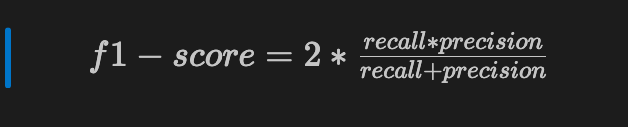
2 * ((recall * precision) / (precision + recall))
What is the Accuracy in Classification Report
The accuracy measures the accuracy of all predictions (positive and negative).
Accuracy should be as high as possible.
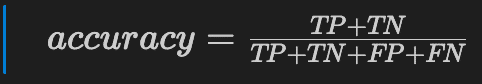
(true positive + true negative) / total predictions
What is Support in Classification Report
The support is the number of occurrences of each class in your y_test
How to compute the classification report with Scikit-learn
Here is how to compute a classification report on a k-nearest neighbors algorithm.
import pandas as pd
from sklearn.datasets import load_breast_cancer
from sklearn.neighbors import KNeighborsClassifier
from sklearn.metrics import classification_report
from sklearn.model_selection import train_test_split

def to_target(x):
    """Map targets to target names"""
    return list(dataset.target_names)[x]

# Load data
dataset = load_breast_cancer()
df = pd.DataFrame(dataset.data,columns=dataset.feature_names)
df['target'] = pd.Series(dataset.target)
df['target_names'] = df['target'].apply(to_target)


# Define predictor and predicted datasets
X = df.drop(['target','target_names'], axis=1).values
y = df['target_names'].values

# split taining and test set
X_train, X_test, y_train, y_test = train_test_split(X, y, test_size=0.3, random_state=42, stratify=y)

# train the model
knn = KNeighborsClassifier(n_neighbors=8)
knn.fit(X_train, y_train)
y_pred = knn.predict(X_test)

# compute accuracy of the model
knn.score(X_test, y_test)

# compute the classification report
print(classification_report(y_test, y_pred))
Definitions
| Classification report | Calculation of the accuracy of a classification model |
| Scikit-learn | Machine learning package in Python |
| Precision | Accuracy of positive predictions |
| Recall | Fraction of correctly identified positive predictions |
| f1-score | Harmonic mean of precision and recall |
Conclusion
We now explained how to interpret and compute the classification report to measure the accuracy of your classification algorithm.

SEO Strategist at Tripadvisor, ex- Seek (Melbourne, Australia). Specialized in technical SEO. Writer in Python, Information Retrieval, SEO and machine learning. Guest author at SearchEngineJournal, SearchEngineLand and OnCrawl.