In this guide, we will introduce summary statistics for data science, by providing Python examples to illustrate how to apply this concept.
Navigation
Show
What Are Summary Statistics?
Summary statics are used in descriptive statistics to summarize and describe observations in a dataset.
Summary Statistics Measures
Summary statistics are generally used for data exploration to communicate large amounts of data into their simplest patterns.
Summary statistics include measures such as:
- mean (average),
- median (middle value),
- mode (most frequent value),
- standard deviation (measure of data dispersion),
- quartiles (dividing data into four equal parts).
Summary Statistics Examples
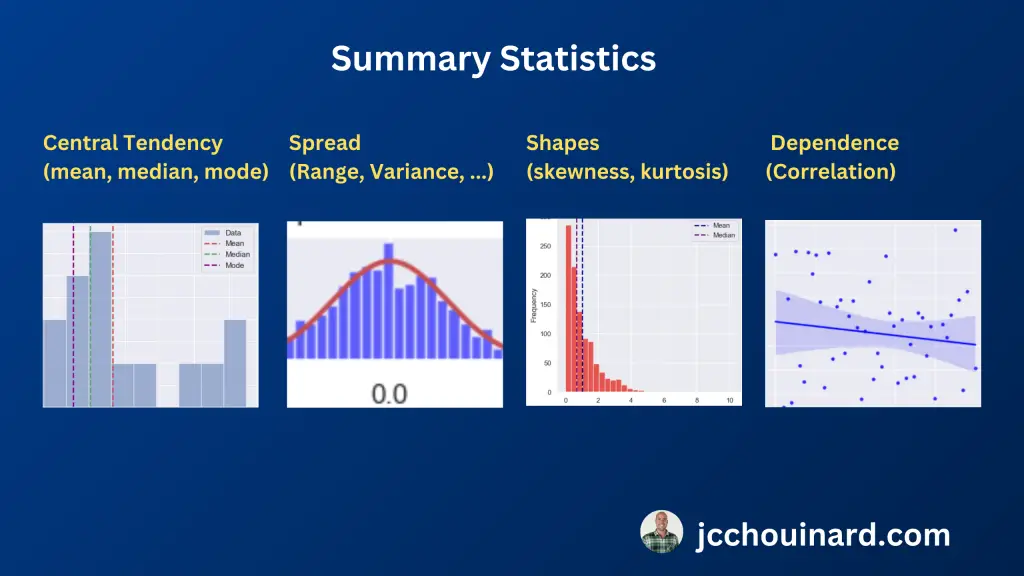
Summary Statistics summarize and describe observations from a dataset by looking at:
- Measures of central tendency: mean, median, mode
- Measures of the shapes of the distributions: skewness, kurtosis
- Measures of variability (spread, dispersion): variance, standard deviation
- Measures of statistical dependence: correlation
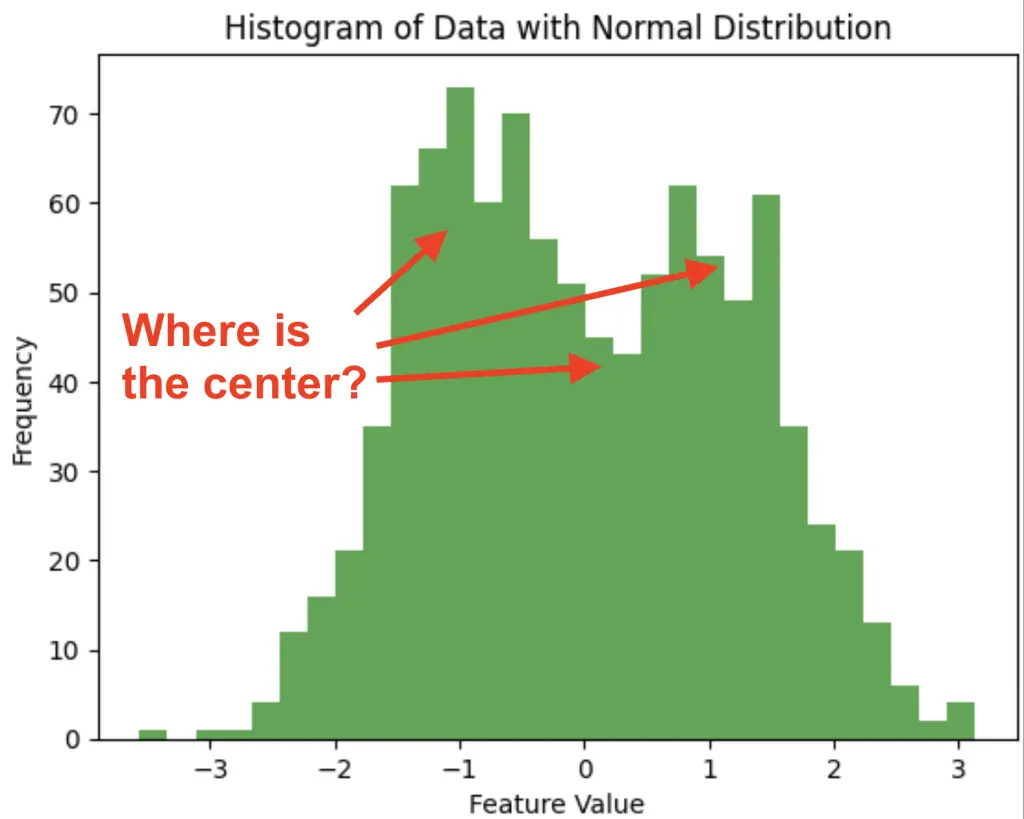
1. Measures of Central Tendency in Summary Statistics
In statistics, measures of central tendency are used to summarize the data by finding where the center of the data is. The 3 measures of center are the mean the median and the mode.
- Mean: Average value of a dataset.
- Median: Middle value in a dataset.
- Mode: Most frequently occurring value in a dataset.
Here are general guidelines that will help you choose the right measure of central tendency.
- Mean: More sensitive to outliers. Better for symmetrical data (normally distributed).
- Media: Less sensitive to outliers. Better for non-symmetrical (skewed) data.
- Mode: More appropriate for categorical data
Read our tutorial on the measure of central tendency to learn more about the topic.
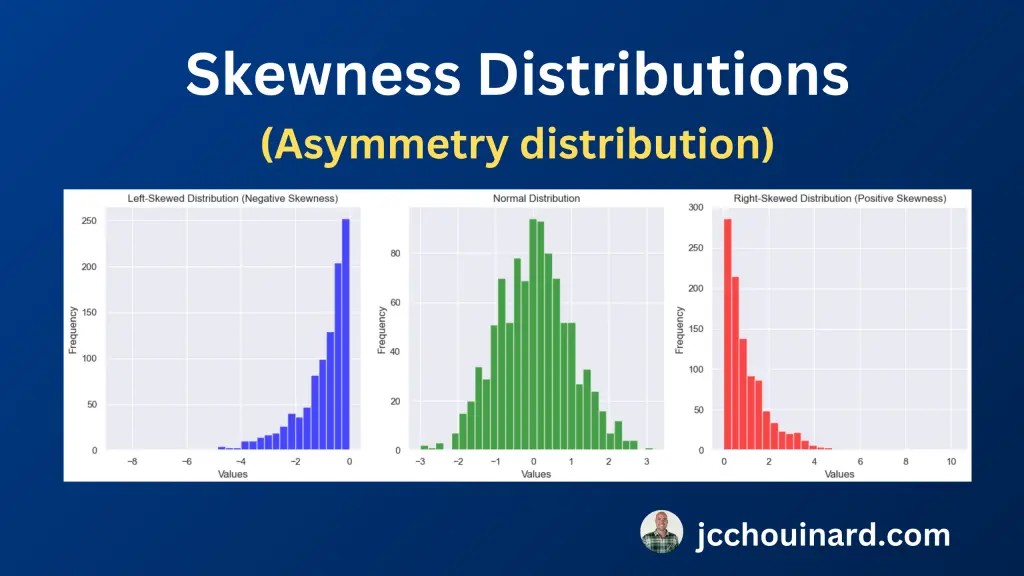
2. Measures of the Shapes of the Distributions in Summary Statistics
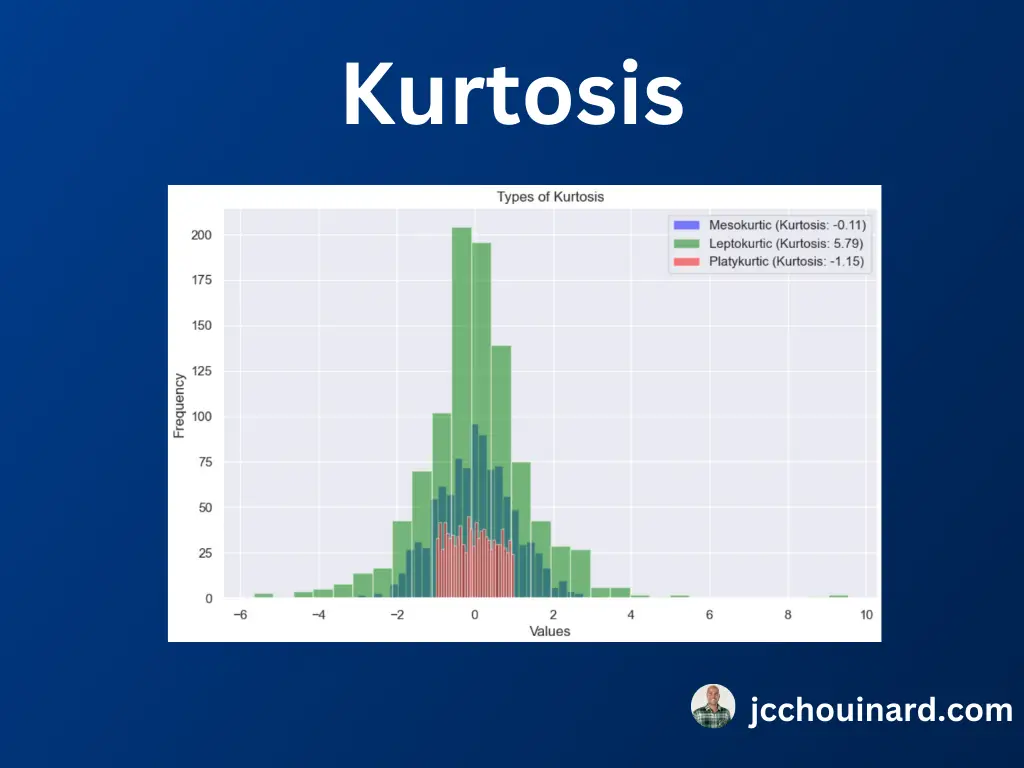
Data may be distributed in different ways. Sometimes it is symmetrical (e.g. normal distribution), sometimes it is non-symmetrical (e.g. right/left skewed), and sometimes is narrower and steeper than others (e.g. kurtosis).
To identify describe these different shapes of distribution, statisticians use mainly two different kinds of summary statistics:
- Skewness: measure of the asymmetry of a distribution
- Kurtosis: measure of the tailedness of a distribution
When evaluating the skewness in the data, we are evaluating the asymmetry of the distribution and whether it is normal, left or right skewed.
- Zero skew: mean = median, normal distribution
- Left Skew: mean < median,
- Right Skew: mean > median
When evaluating kurtosis in the data, we are evaluating the tailedness of the distribution and how extreme the data is to outliers. The three types of distributions with kurtosis are:
- Leptokurtic: Large tails, more extreme outliers, positive kurtosis
- Mesokurtic: Medium tails, kurtosis equal to zero
- Platykurtic: Thin tails, less extreme outliers, negative kurtosis
To learn more, read our article on the measures of shapes and distributions in summary statistics.
3. Measures of Variability (Spread) in Statistics
To understand the distribution of the data, it is important to understand the variability (or spread) of the data. The variability describes how close or spread apart the data points are.
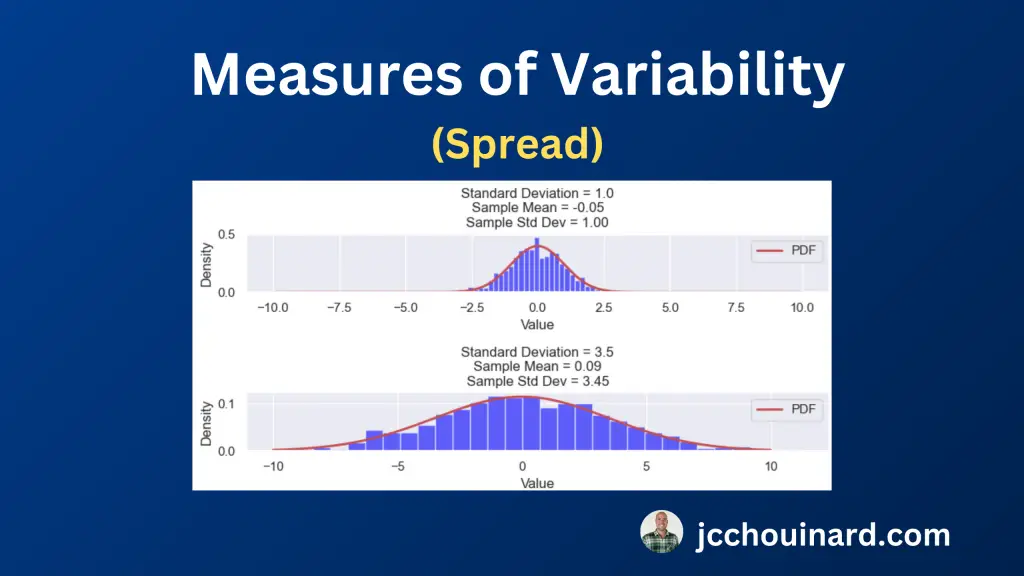
The 8 measures of variability in summary statistics are the range, the interquartile range (IQR), the variance, the standard deviation, the Coefficient of Variation (CV), the Mean Absolute Deviation, the Root Mean Square (RMS) and the Percentile Ranges.
- Range: Difference between the maximum and minimum values in a dataset
- Interquartile Range (IQR): Difference between the third and first quartiles (Q3 and Q1) . Focuses on the middle 50% to reduce the impact of outliers.
- Variance: Average distance of each data point from the mean
- Standard Deviation: Square-root of the variance
- Coefficient of Variation (CV): Percentage ratio of the standard deviation to the mean
- Mean Absolute Deviation: Average absolute difference between data points and the mean
- Root Mean Square (RMS): Square root of the mean of the squared values.
- Percentile Ranges: Ranges between specific percentiles to provide insights into the central of the data less influenced by extreme values.
To learn more about this topic, read our article on the measures of variability in statistics.
4. Measures of Statistical Dependence (Correlation) in Summary Statistics
The 8 measures of statistical dependence used to evaluate the correlation between multiple variables are:
- Covariance: How much two random variables change together
- Correlation Coefficient: Linear relationship of two continuous variables
- Spearman’s Rank Correlation: Strength/direction of the monotonic relationship between two variables.
- Kendall’s Tau (τ): Strength/direction of ordinal association between two variables.
- Point-Biserial Correlation: Relationship between a continuous and a binary variables
- Phi Coefficient (φ): Association between two binary variables.
- Contingency Tables / Chi-Square Tests: Association between two categorical variables
- Cramér’s V: Association for categorical variables based on chi-square statistics
Read our tutorial on the topic to understand what are the measures of statistical dependence, how they work, and how to use them in Python.
Summary Statistics in Machine Learning
Summary statistics are a crucial component of data preprocessing for machine learning.
As we have seen, summary statistics are used by data scientists to gain a insight into the dataset’s central tendencies, variations, and outliers.
Using this information, data scientist can prepare the data for machine learning through data scaling, normalization, and handling missing values.
Summary statistics are also used by popular machine learning algorithms like decision trees, random forests, and k-nearest neighbors to make split decisions and/or determine feature importance.
For example, decision tree algorithms uses measures like Gini impurity or entropy, which rely on summary statistics to evaluate feature splits. In regression models, summary statistics help identify relationships between variables, aiding in feature selection and model interpretation.
At their core, summary statistics help to enhance data quality and facilitate machine learning model training.
Conclusion
In conclusion, summary statistics in Python play a important role in data understanding.
Summary statistics provide insights for data scientists and analysts into the central tendency, spread, and distribution of data.
Common summary statistics include:
- measures of central tendency (mean, median, mode),
- measures of variability (variance, standard deviation, range),
- Measures of the shapes of the distributions
- measures of statistical dependence (correlation coefficients like Pearson’s r, Spearman’s ρ, and Kendall’s τ).
Python has libraries such as NumPy, pandas, and SciPy to calculate and visualize summary statistics.
Understanding summary statistics is essential for data exploration, hypothesis testing, and model building, making it a fundamental skill for data scientists and analysts working with Python.

SEO Strategist at Tripadvisor, ex- Seek (Melbourne, Australia). Specialized in technical SEO. Writer in Python, Information Retrieval, SEO and machine learning. Guest author at SearchEngineJournal, SearchEngineLand and OnCrawl.