In this guide, we will introduce one of the summary statistics: the measures of the shapes of the distributions. We will also provide you with Python examples to illustrate how to apply this concept.
Navigation
Show
What are the Measures of the Shapes of the Distributions in Summary Statistics
The measures of the shapes of the distributions are a summary statistic used to understand data characteristics, identify outliers, and improve modelling decisions.
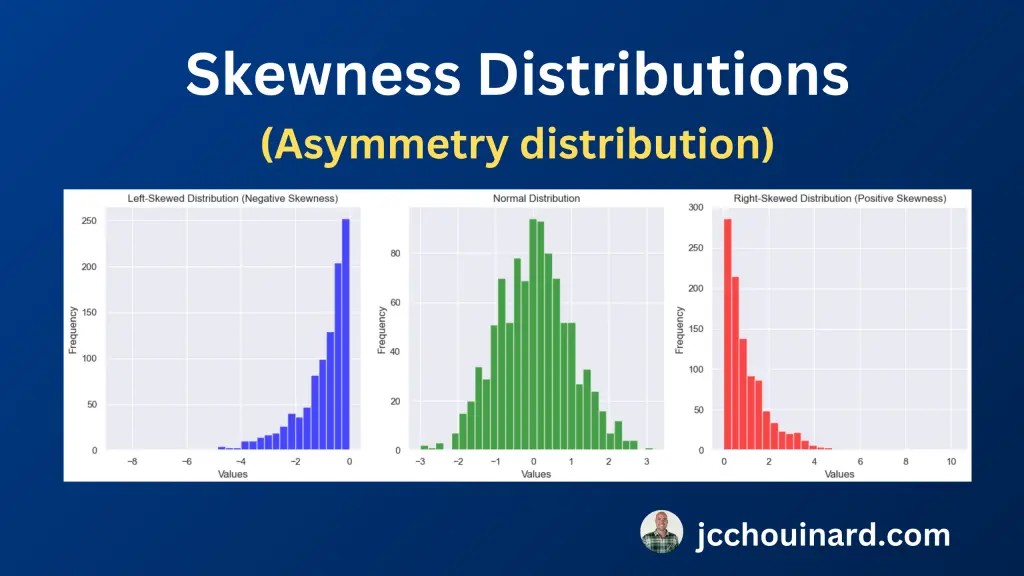
Data may be distributed in different ways. Sometimes it is symmetrical (e.g. normal distribution), sometimes it is non-symmetrical (e.g. right/left skewed), and sometimes is narrower and steeper than others (e.g. kurtosis).
To identify describe these different shapes of distribution, statisticians use mainly two different kinds of summary statistics:
- Skewness: measure of the asymmetry of a distribution
- Kurtosis: measure of the tailedness of a distribution
What is Skewness in Summary Statistics?
In summary statistics, the skewness is the measure of the asymmetry of a distribution.
Simply put, it shows how symmetrical both sides of the peak of a curve are.
A distribution can be:
- Zero skew
- Left Skewed (negative skew)
- Right Skewed (positive skew)
Zero Skew
When we think of the bell-shaped normal distribution, we say that it has zero skew. Zero skew means that the left side and right sides are mirror images.
The normal distribution is not the only distribution that have zero skew. The uniform distribution for example also has zero-skew.
A distribution is zero skew when the mean and the median are equal:
# zero skew
mean = median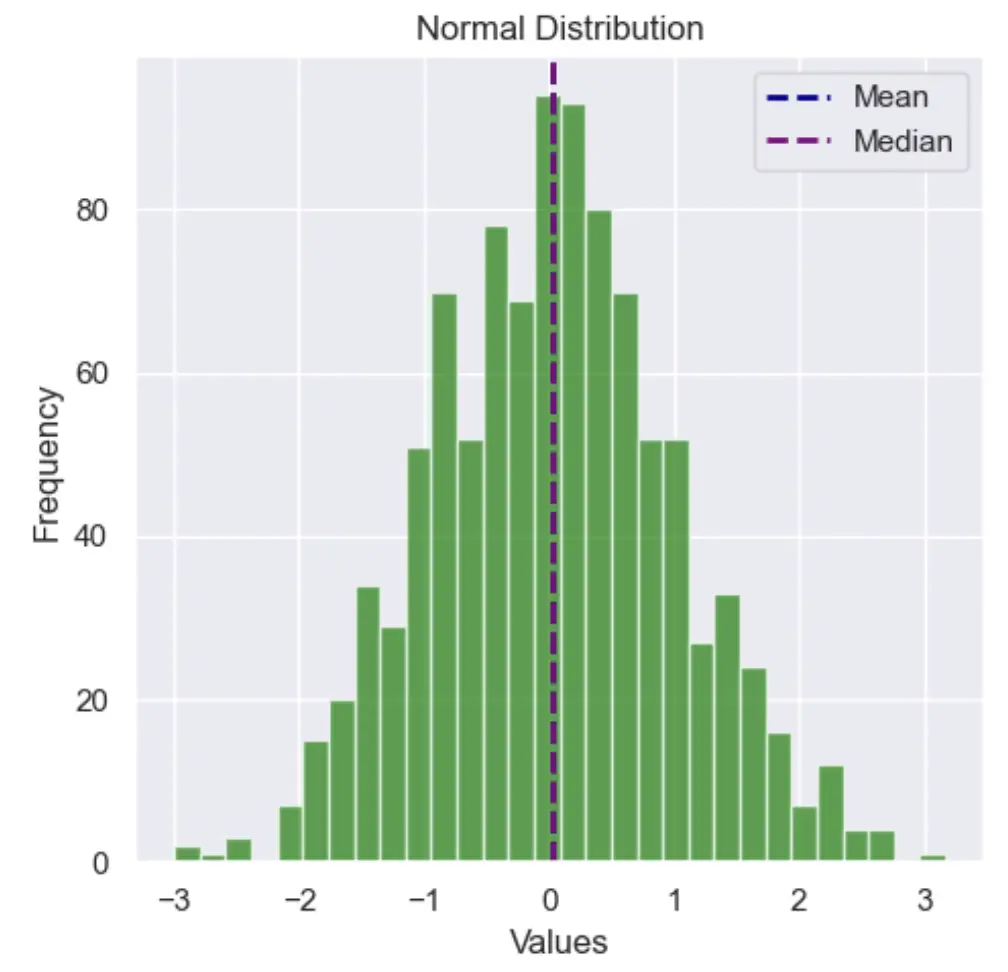
Left Skewed (negative skew)
Skewness can be understood in terms of tails. A distribution is left skewed when it is longer on the left side of its peak, than on its right.
A distribution is left skewed when the mean is smaller than the median:
# left skew
mean < median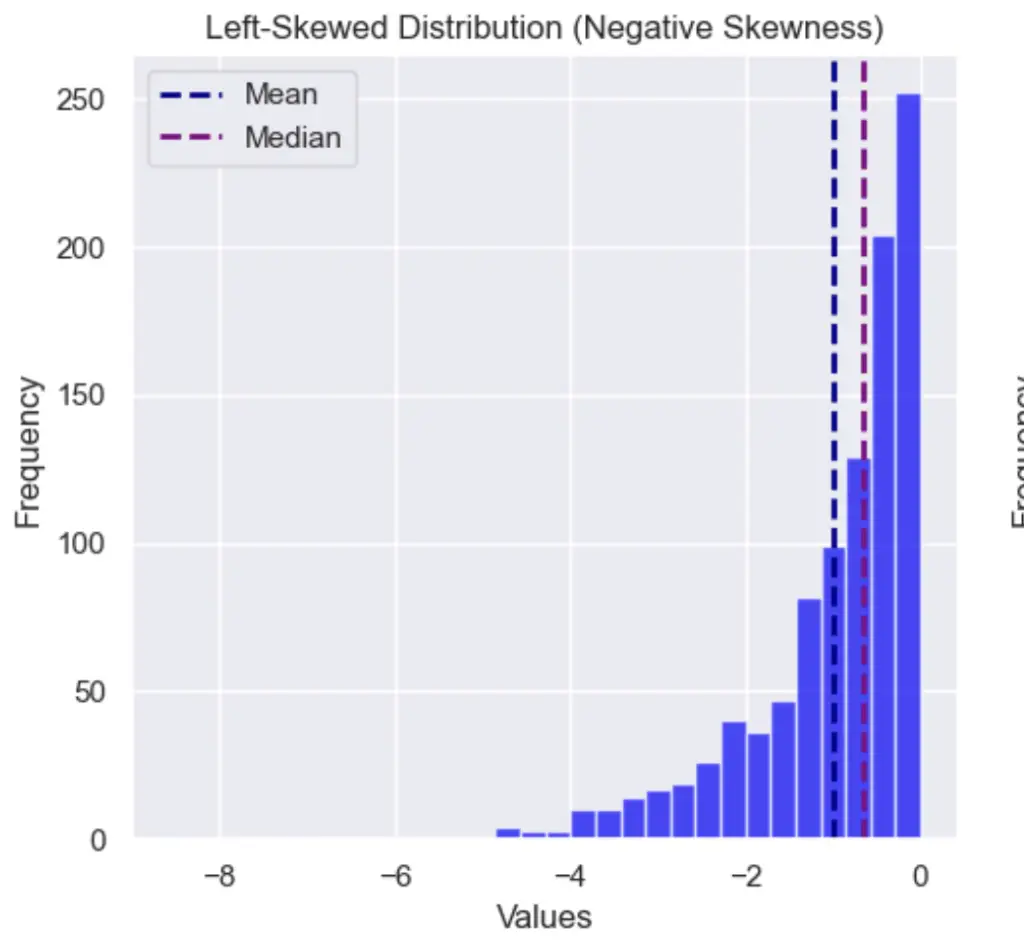
Right Skewed (Positive skew)
A distribution is positive, or right-skewed, when it is longer on the right side of its peak, than on its right.
A distribution is right skewed when the mean is greater than the median:
# right skew
mean > median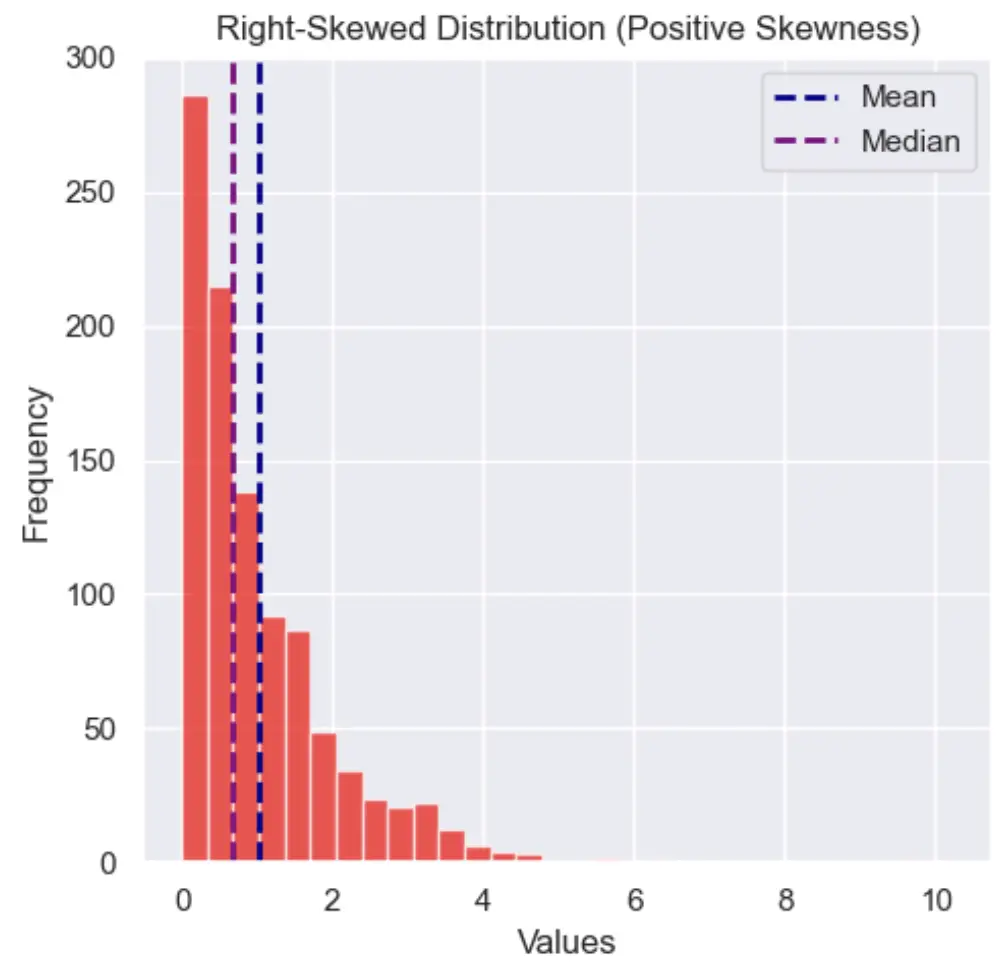
What is Kurtosis in Summary Statistics?
In summary statistics, the kurtosis is the measure of the tailedness of a distribution.
Simply put, it shows if data in a distribution are more or less extreme (outliers) than a normal distribution.
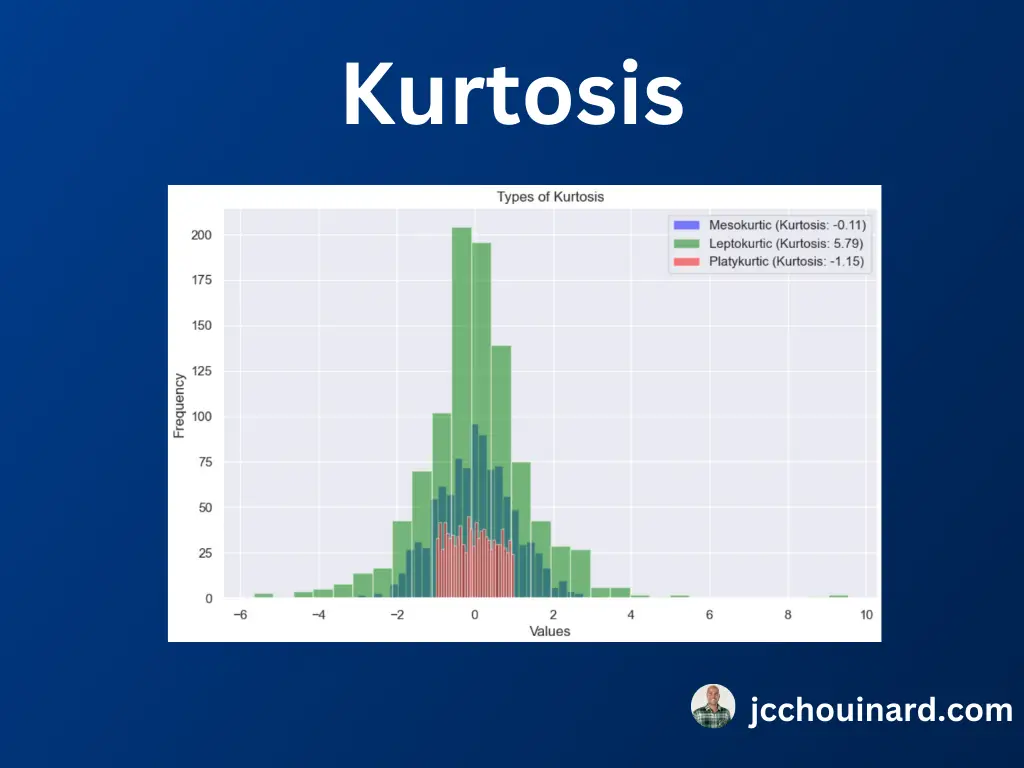
The three types of distributions with kurtosis are:
- Leptokurtic: Large tails, more extreme outliers, positive kurtosis
- Mesokurtic: Medium tails, kurtosis equal to zero
- Platykurtic: Thin tails, less extreme outliers, negative kurtosis
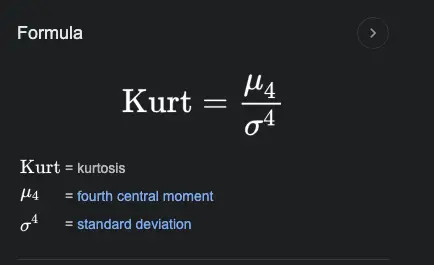
Formula of the Kurtosis
The formula for the kurtosis is the sum of the differences of each data point from the mean to the fourth, divided by the standard deviation to the fourth.
kurtosis = Σ(x - µ)^4 / σ^4Google simplified this removing the sum of differences.
Calculate Kurtosis with Python
To calculate the kurtosis of a dataset in Python, use the kurtosis function from the scipy.stats libary.
import numpy as np
from scipy.stats import kurtosis

# Sample dataset from a normal distribution
data = np.random.normal(0, 1, 1000)

# Calculate kurtosis
kurtosis_value = kurtosis(data)

print(f"Kurtosis: {kurtosis_value:.2f}")
How to Interpret Kurtosis Numbers
As a general guideline, when evaluating the result of a kurtosis:
- a positive value indicate a Leptokurtic distribution that is more peaked than normal (more extreme outliers)
- a negative value indicates a Platykurtic distribution that is more flatter than normal (less extreme outliers).
- a value that equals 0 indicates Mesokurtic distribution that follows the normal.
- Values beyond −2 and +2 are considered indicative of excessive flatness or peakness

SEO Strategist at Tripadvisor, ex- Seek (Melbourne, Australia). Specialized in technical SEO. Writer in Python, Information Retrieval, SEO and machine learning. Guest author at SearchEngineJournal, SearchEngineLand and OnCrawl.