In this guide, we will introduce one of the summary statistics: the measures of central tendency. We will also provide you with Python examples to illustrate how to apply this concept.
What are Measures of Central Tendency?
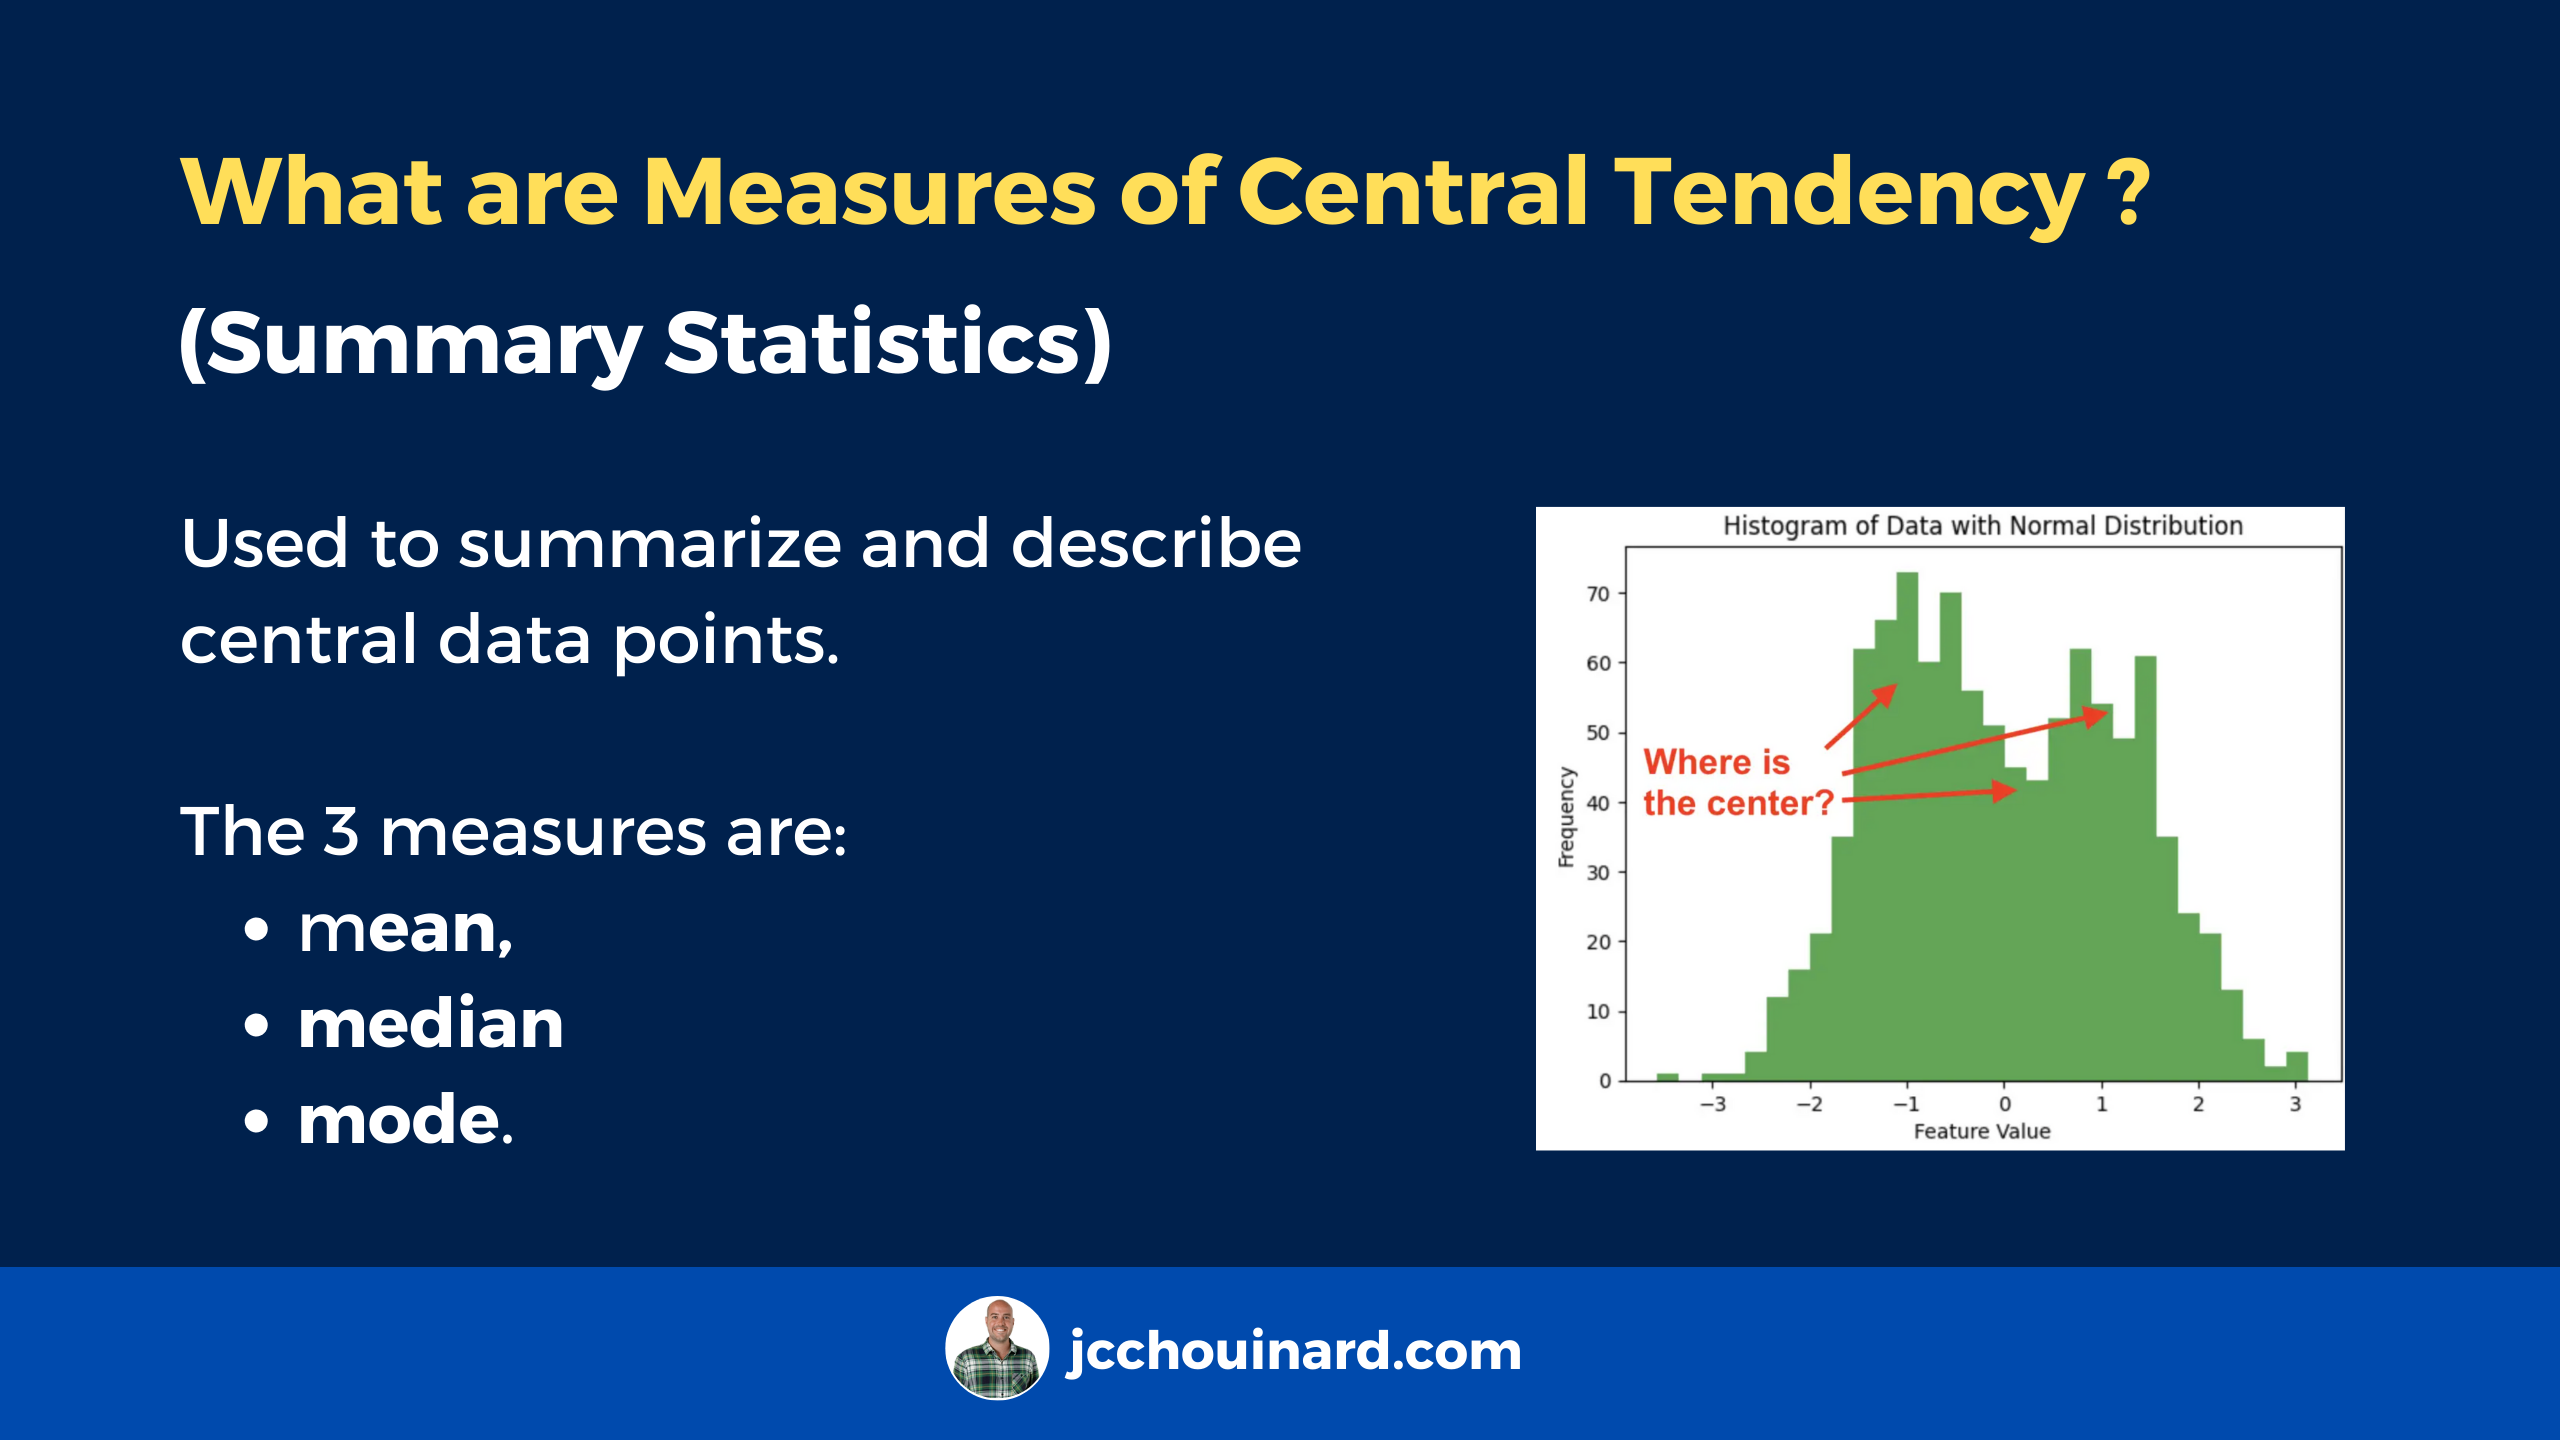
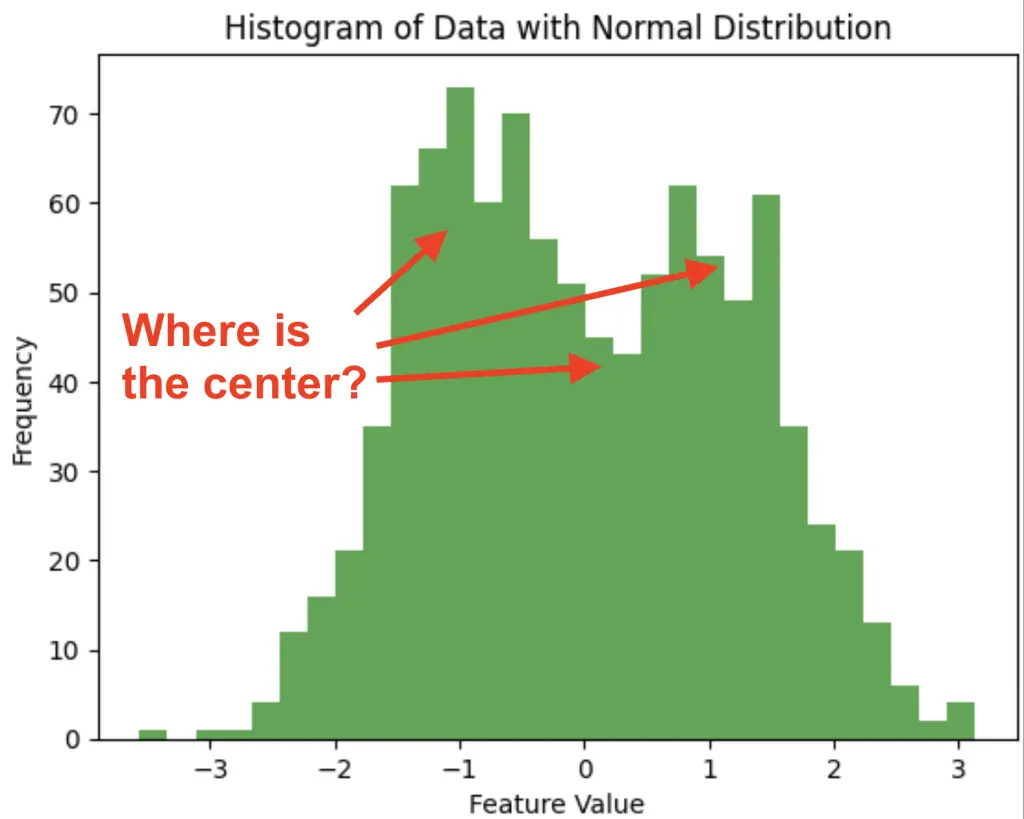
In statistics and data science, measures of central tendency are used to summarize the data by finding where the center of the data is. The 3 measures of center are the mean the median and the mode.
- Mean: Average value of a dataset.
- Median: Middle value in a dataset.
- Mode: Most frequently occurring value in a dataset.
What is the Mean in Statistics
In statistics, the mean, also known as the average, is a measure of central tendency.
The mean is calculated by summing up all the values in a dataset and then dividing that sum by the total number of values. The formula for calculating the mean (μ) of a dataset is:
Mean (μ) = Sum of all values / Number of values (n) For example, if we have 3 people aged 5, 7 and 8 years old, then the mean is
Mean (μ) = (5 + 7 + 8) / 3 ~= 6.67And can be calculated in Python using np.mean of the numpy library.
import numpy as np

np.mean([5,7,8])
# 6.666666666666667
What is the Median in Statistics
In statistics, the median is a measure of central tendency where 50% of the data is lower than it an 50% of the data is higher.
The median is calculated by sorting all the values in a dataset and then selecting the middle one.
In Python, the median can be calculated using np.median of the numpy library.
import numpy as np

np.median([1,2,3,4,5,6,7])
# 4.0
What is the Mode in Statistics
In statistics, the mode is a measure of central tendency where the most frequently occurring value in a dataset.
When we use the value_counts() method on a Pandas DataFrame, we are seeing the occurrences of values sorted by most frequent. The top value is the mode.
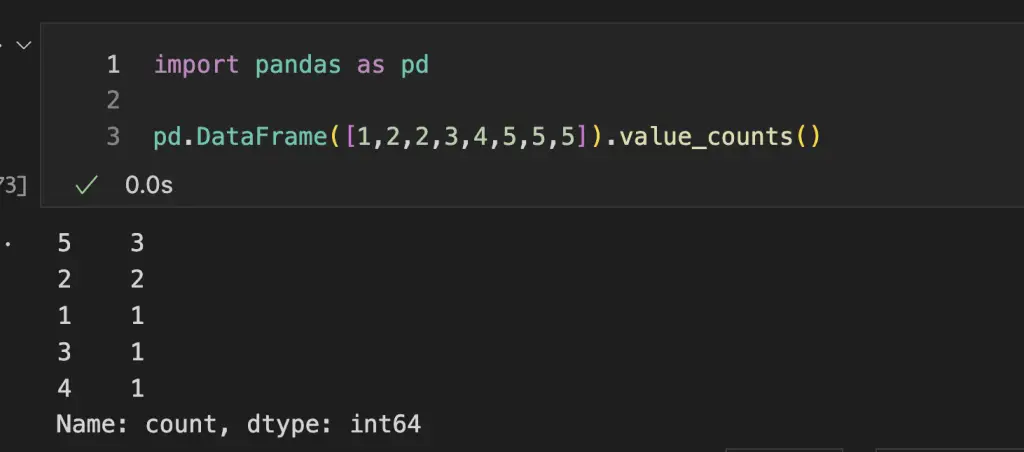
The mode can be calculated in Python using the scipy.stats.mode() or the statistics.mode() functions.
from scipy import stats
import statistics

data = [1,2,2,3,4,5,5,5]

print(stats.mode(data).mode)
print(statistics.mode(data))
The mode is often used on categorical variables since they are often unordered and generally don’t have a numeric representation.
Mean, Mode or Median? How to Choose the Right Measure of Central Tendency
Choosing the right measure of central tendency (mean, mode, or median) depends on your data and the information you want to draw from it. While the mean is the most often used measure, it may not be the best, follow these quick guidelines to understand which measure to choose:
- Mean: More sensitive to outliers. Better for symmetrical data (normally distributed).
- Median: Less sensitive to outliers. Better for non-symmetrical (skewed) data.
- Mode: More appropriate for categorical data

SEO Strategist at Tripadvisor, ex- Seek (Melbourne, Australia). Specialized in technical SEO. Writer in Python, Information Retrieval, SEO and machine learning. Guest author at SearchEngineJournal, SearchEngineLand and OnCrawl.