This post will help you use Chrome DevTools to solve some of the most common SEO tasks.
Navigation
Show
What is Chrome DevTools
Chrome DevTools is a set of web developer tools built directly into the Google Chrome browser.
How to Open Chrome DevTools?
To open Chrome Devtools on Windows, use CTRL + Shift + I.
To open Chrome Devtools on Mac, use ⌘ command + ⌥ option + I.
You can also right-click on an element and select inspect.
To open the Javascript console, press CTRL + Shift + J .
Why Use Chrome DevTools?
There are multiple things you can do in Chrome DevTools such as automating your SEO tasks, writing custom JavaScript to be implemented with Google Tag Manager and optimizing your Web Performance.
For example, when you start doing experiments with Google Tag Manager, you start building custom variables and start to modify DOM elements to provide better user experience.
Instead of building your JavaScript functions straight into Google Tag Manager (GTM), you can test your changes using the Chrome DevTool first.
View Page on Mobile
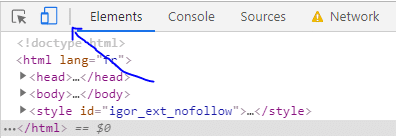
In DevTools you can toggle between different mobile devices to test if your page is responsive.
Switch User-Agent
If you want to view your website like Google does, you need to switch the user-agent to the one that Google uses. See the entire list of Google User Agents.
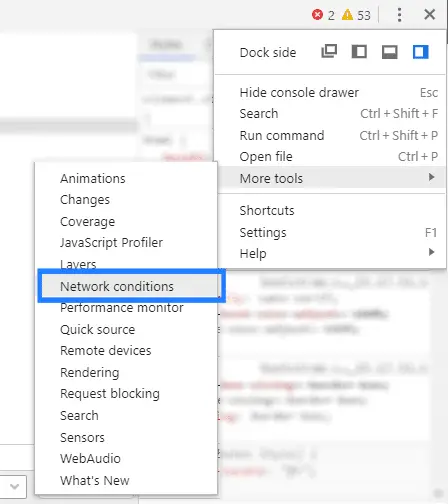
Click on settings > More tools > Network conditions.
Then uncheck select automatically and select Googlebot Smartphone.
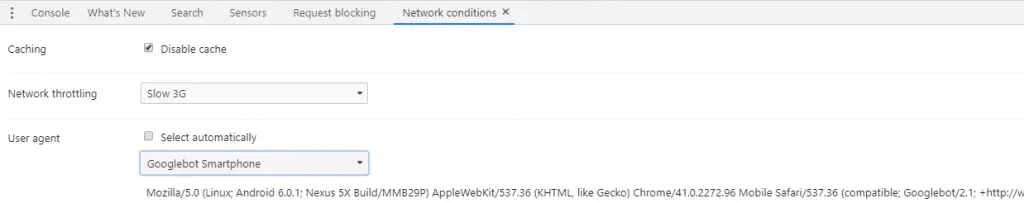
Reload the page.
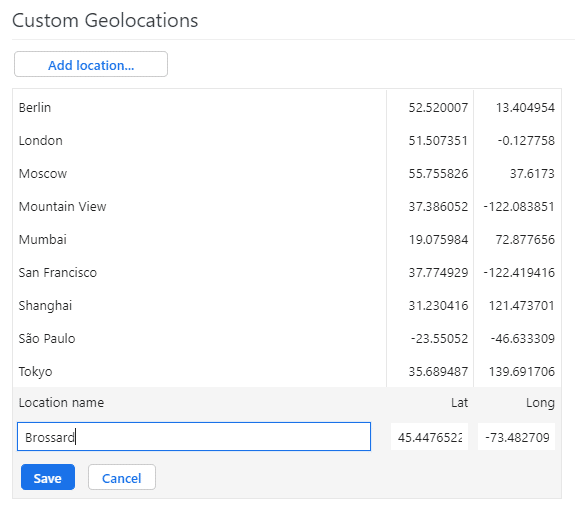
Modify Your Location
You view Google search results from another city by selecting settings > more tools > sensors.
Then you can choose from the list of cities or add your custom location.
Add the name of your city and geolocation parameters that you can easily find in Google Maps.
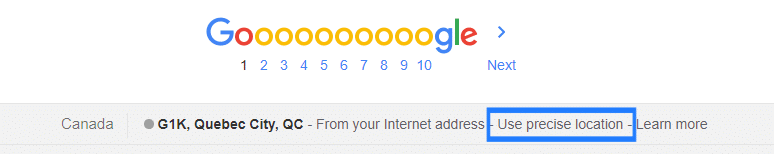
Go to Google Search and perform a query.
Click on “Use Precise location”.
View Difference Between Rendered HTML and Source HTML
You can compare the difference between the source HTML and the rendered HTML .
- The source HTML is the HTML before JavaScript is executed.
- The rendered HTML is the HTML after JavaScript is executed.
View the source HTML in three different ways:
- Use
⌘command + ⌥option + U(on Mac), orCTRL + Shift + U. on Windows. - Right-click and select “
View Page Source“. - Type the URL
view-source:https://example.comin your browser.
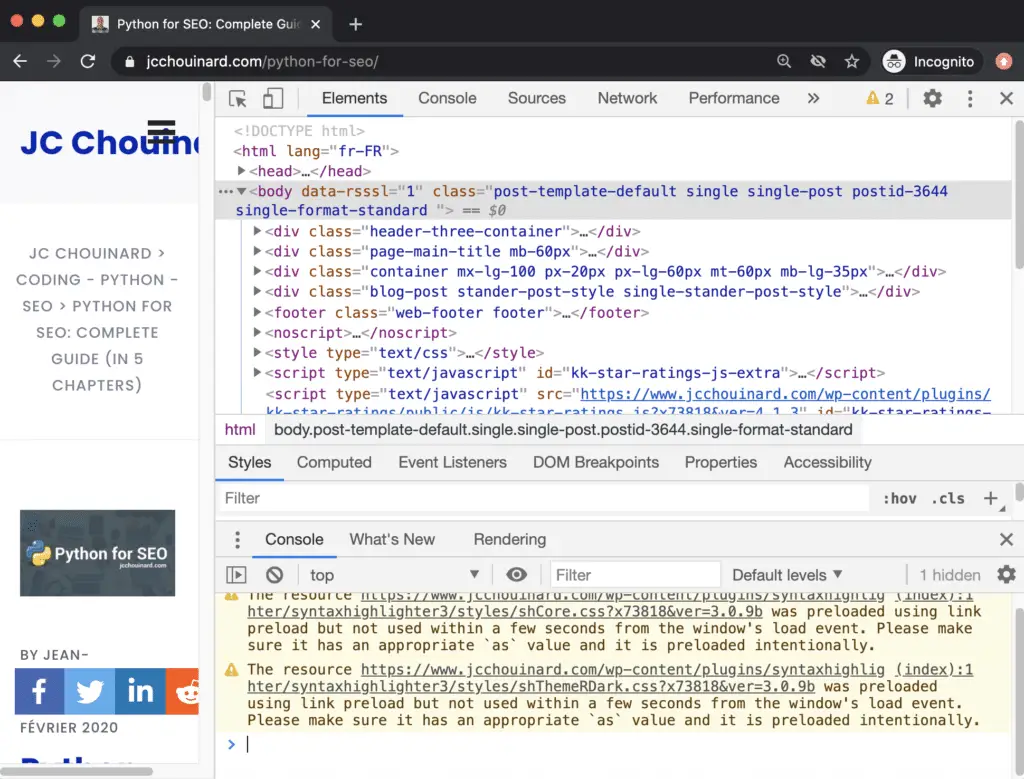
The rendered HTML is basically what you see in the DOM. Access the rendered HTML using:
CTRL + Shift + I or ⌘ command + ⌥ option + I
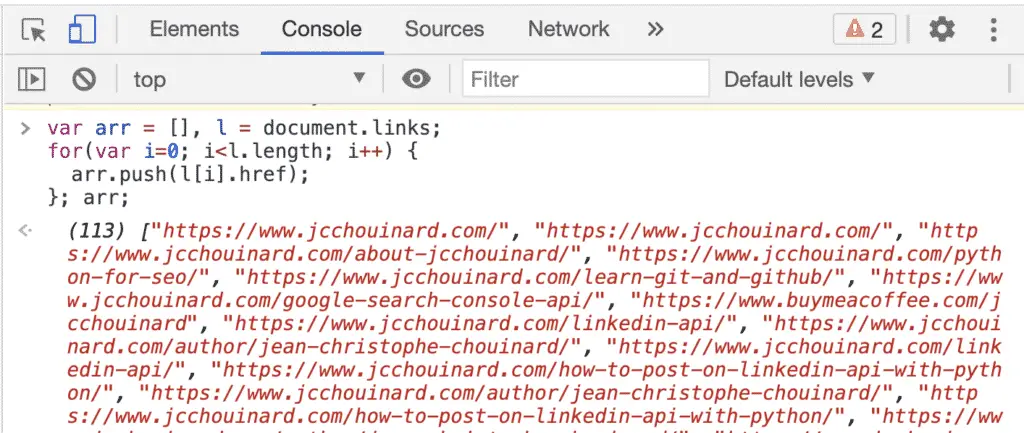
Run JavaScript
Open the JavaScript console with CTRL + Shift + J or ⌘ command + ⌥ option + J.
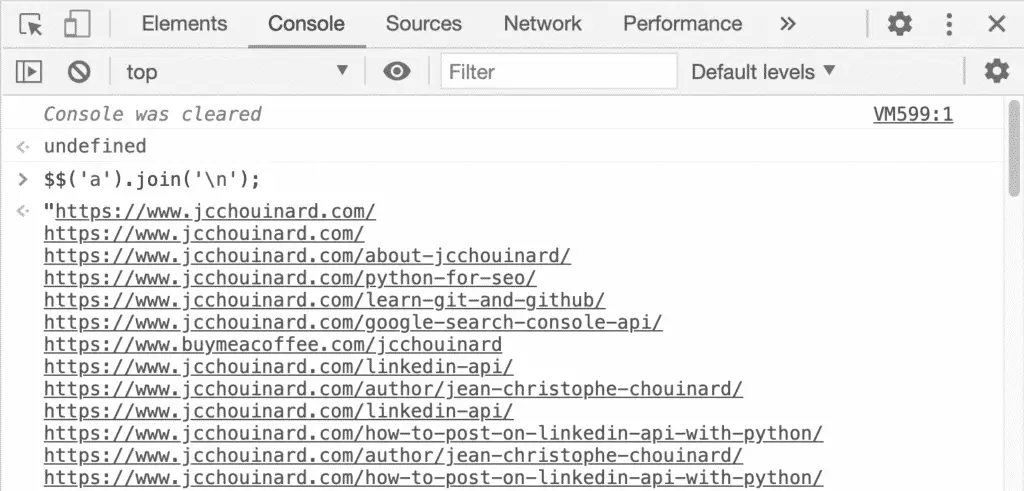
Here, I will extract all the links on the page.
Or, alternatively.
Disable JavaScript
You can view how a website is rendered when JavaScript is disabled using the Command Menu.
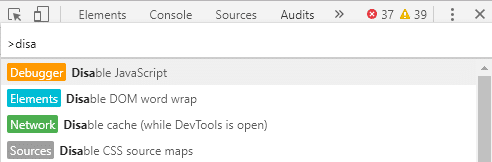
- Open Chrome DevTools
- Press
Control+Shift+P - Select Disable JavaScript
- Reload the page
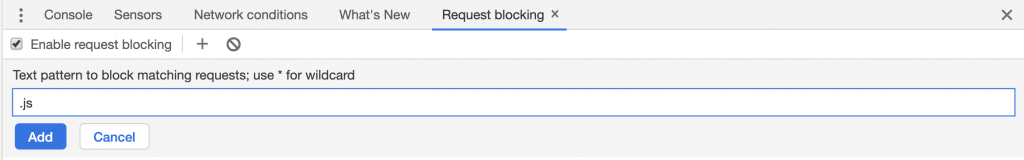
You can also disable all Javascript by adding the .js pattern using Request blocking and then reloading the page.
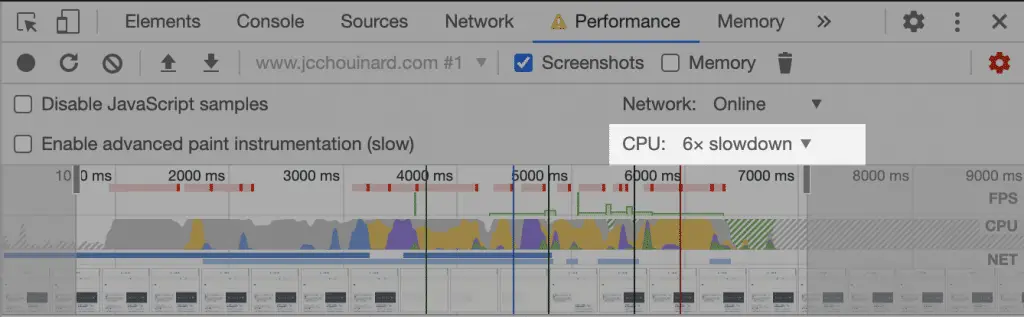
Render Your Site Slower With Less CPU (Throttling)
Go to performance, capture settings, and slowdown CPU.
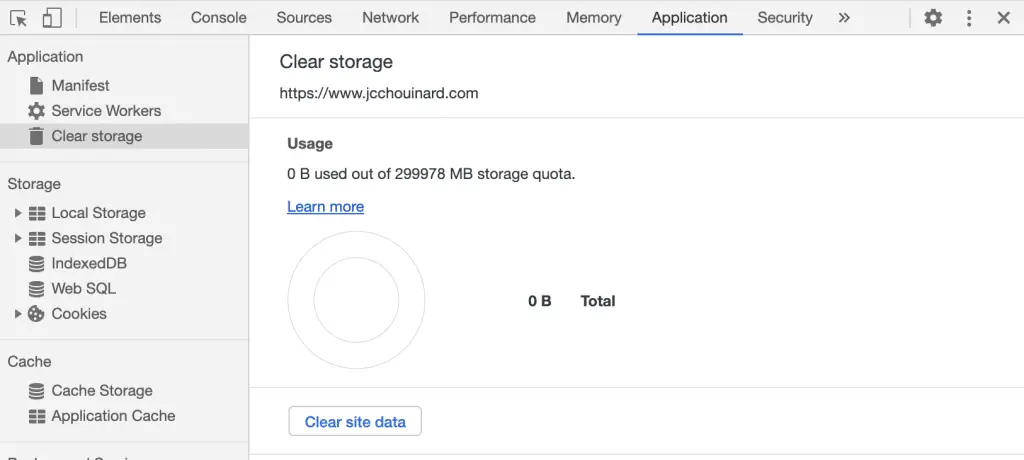
Clear Site Data
To make sure that you test properly, make sure that you clear cache and other site data. To do so, go to Applications > Clear storage > Clear site data.
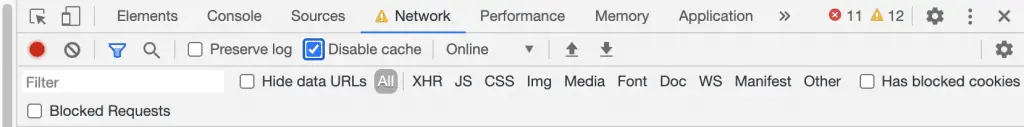
Disable Cache
To disable cache in Chrome Devtools, go to Network > Disable cache.
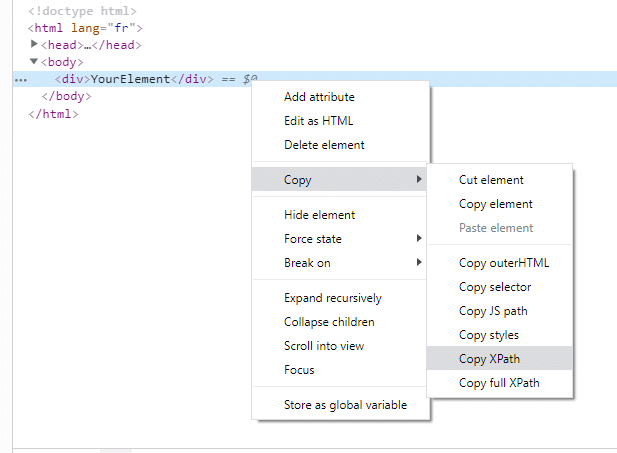
Copy Xpath, CSS selectors and JS Path
One thing that is very useful when you start crawling, scraping or modifying DOM elements is to use Xpath, JS Path and CSS Selectors.
For example, to copy Xpath of a DOM node, all you need to do is right-click on the node copy > copy Xpath.
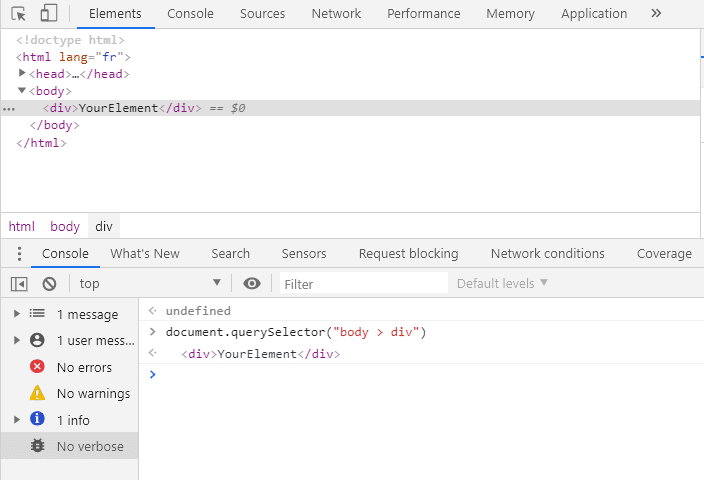
If you copy JS Path, you’ll get something like this that you can add to the JS console to view the element.
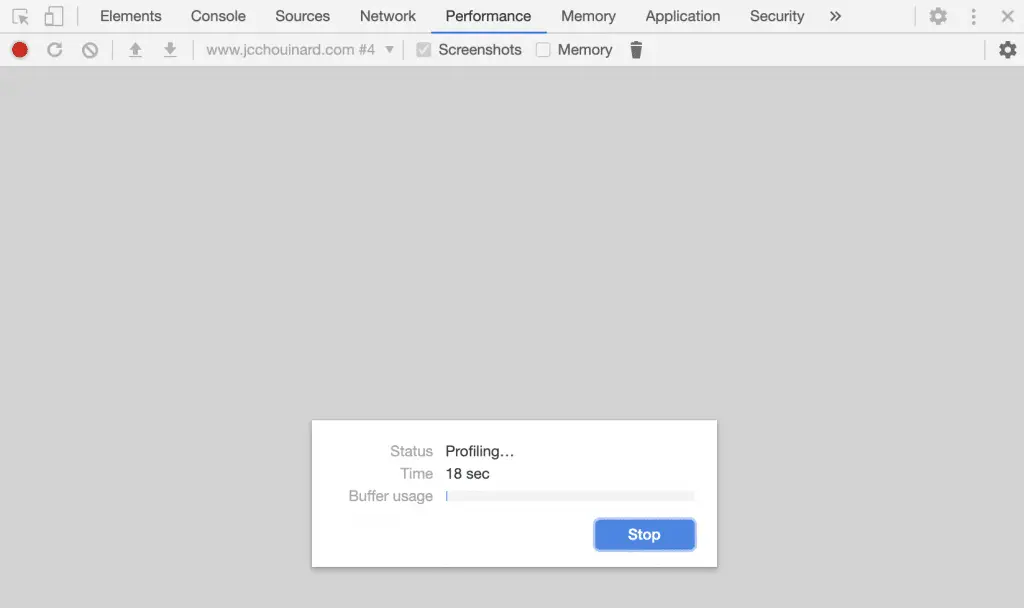
Check Website Performance With the Performance Report
At some point, you will want to know how Google renders your website and see how layout-ing is done, see when the page renders each element, etc.
Go to the performance report.
Click on the Record button, or use Command + E, and reload the page.
Press Stop after a few seconds.
Then, you have your timeline.
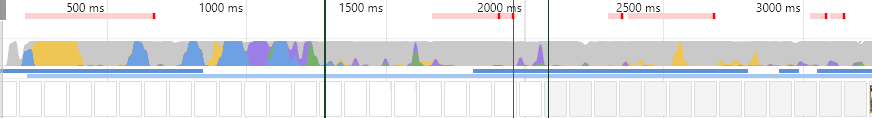
You can check rendering.
You can check other stuff like when events are firing.
Google Lighthouse
To learn how to improve the page speed of your website, watch this video by Google.
View How a Page Behaves if You Block a Resource
When you are optimizing page speed you might want to defer or to remove some resources.
Before you do anything, just know that you can see how if behaves first.
To do so, click on CTRL + Shift + P and write Show Request Blocking.
Click Add pattern
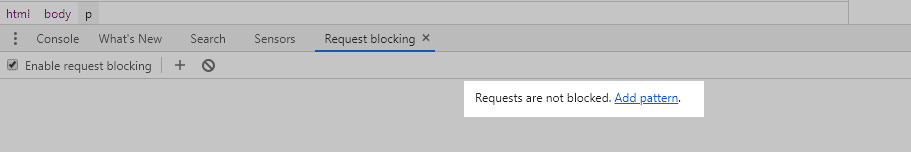
Add any element. In this example, I would like to see how the page behaves if I block jQuery. You could block stuff like your style.css

Reload the page and you will see the way the page is rendered without the resource.
Cumulative Layout Shift (CLS)
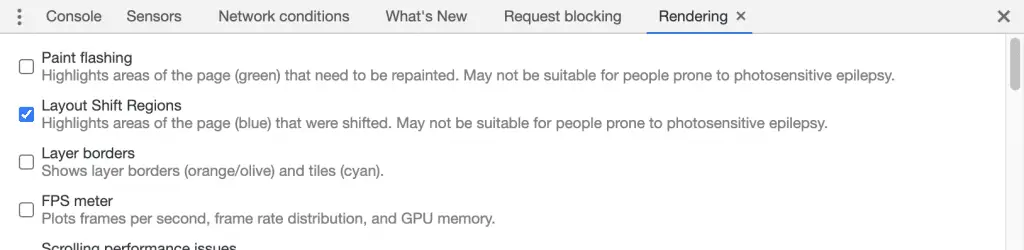
The new Chrome UX report introduced the Cumulative Layout Shift. You can see which regions are impacted by CLS.
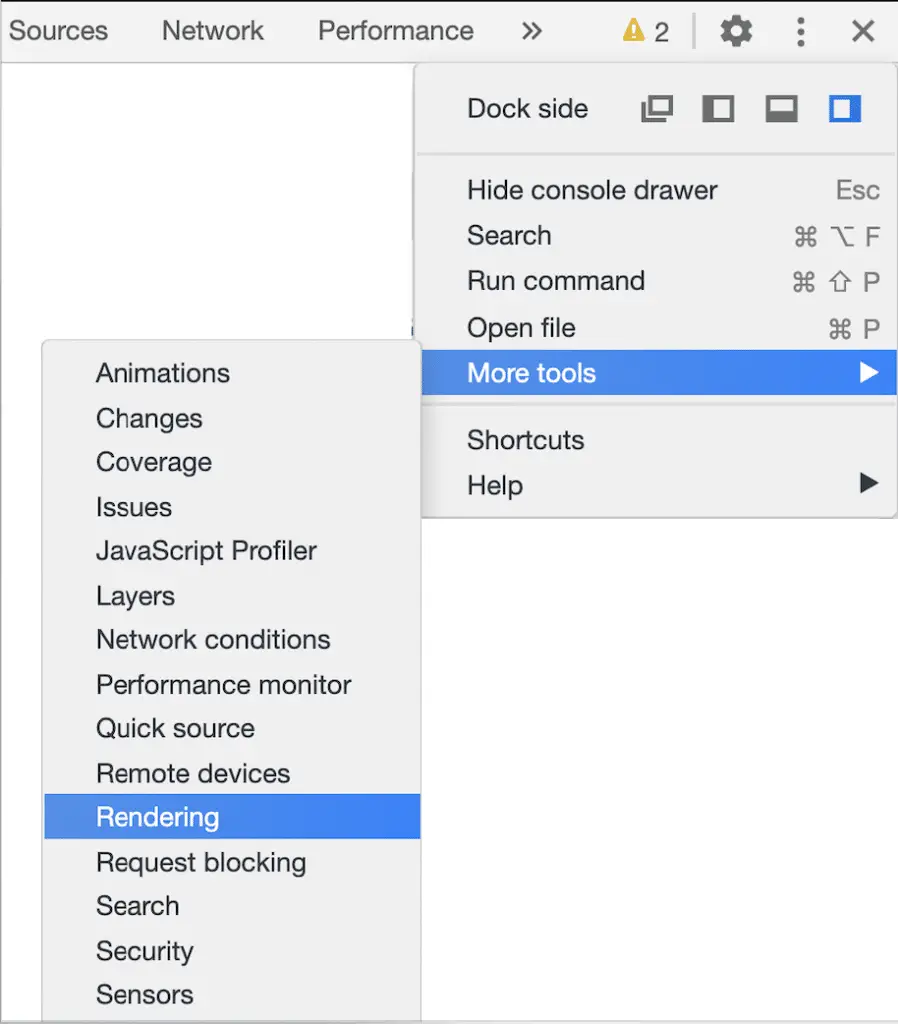
Go to more tools > Rendering and tick Layout Shift Regions.
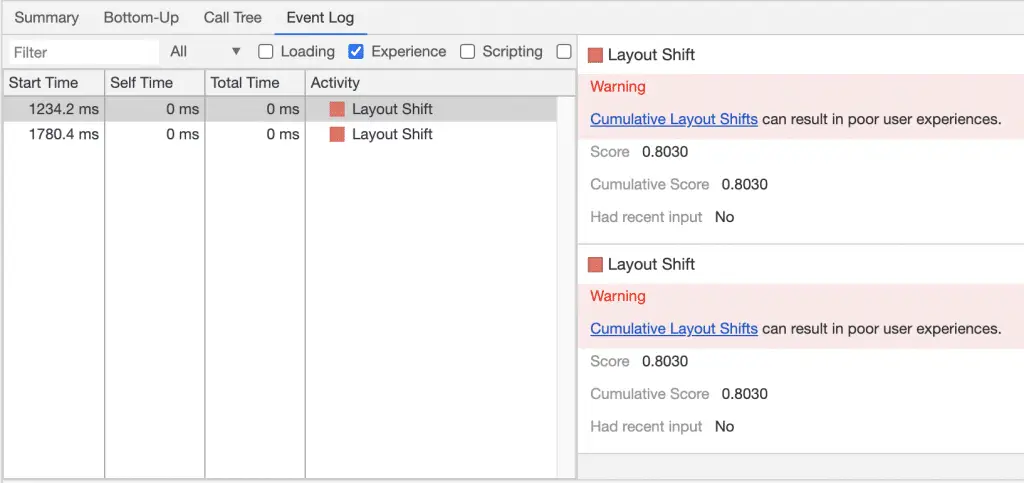
Also, in the performance report, under the Event logs, you can see when the CLS occurred.
Note: in chrome 88, the experience event log was replaced by web vitals.
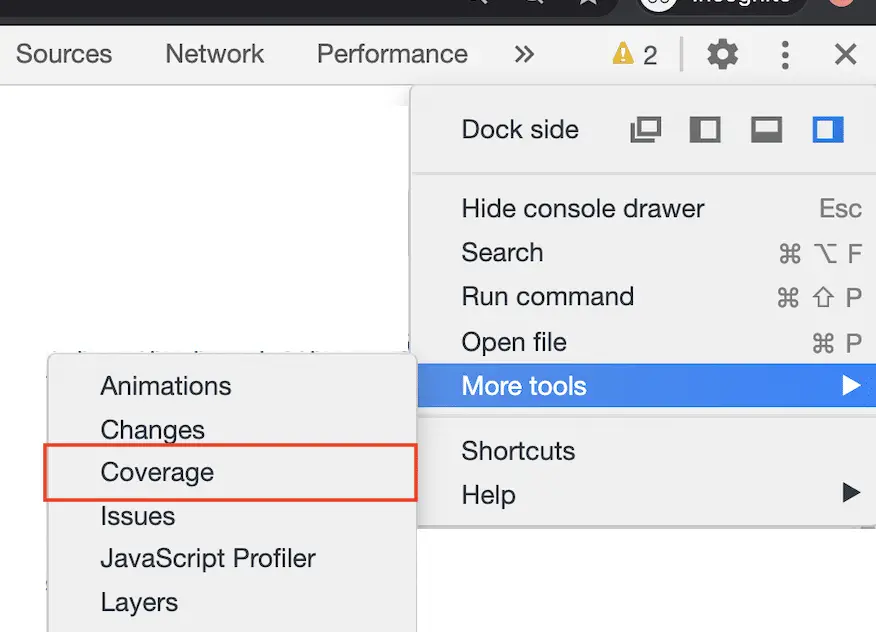
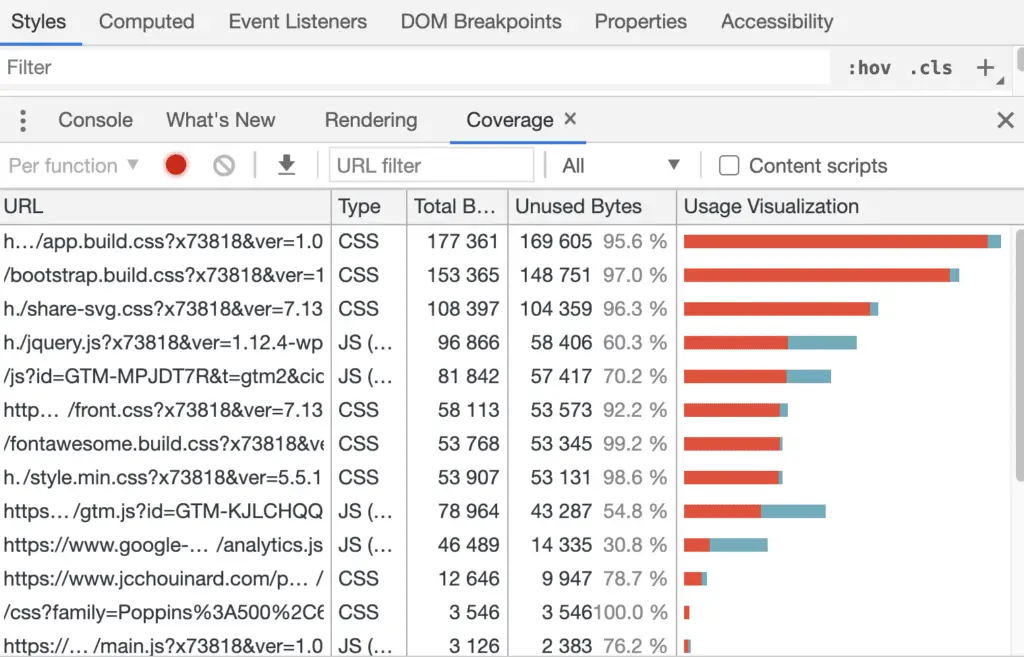
Find Unused JavaScript With Chrome DevTools
Open the Coverage Report.
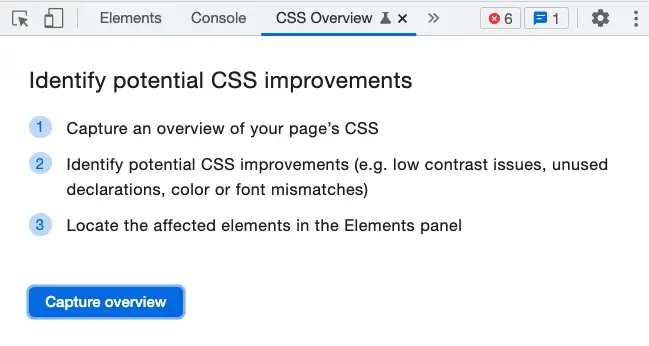
CSS Overview
Chrome DevTools provides a way to get an overview of the CSS used on a site.
First, open the commands views using Command + Shift + P (on Mac) or CTRL + Shift + P (on windows) and search for CSS overview.
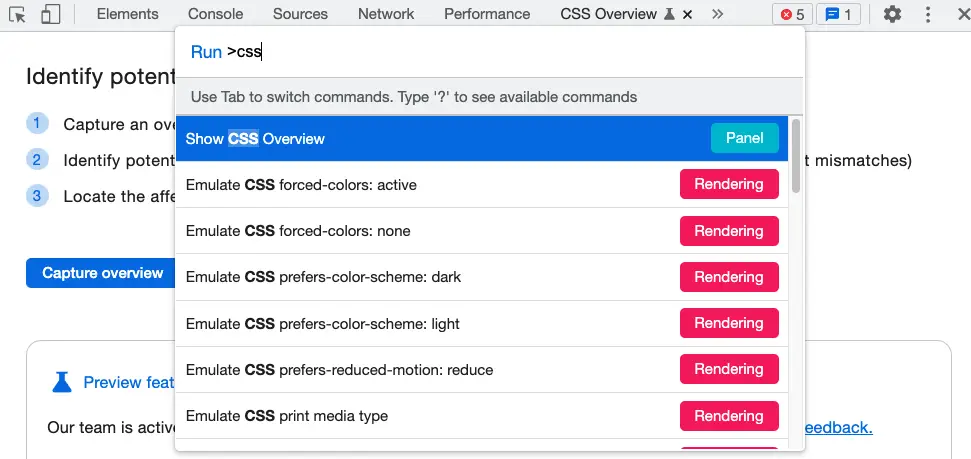
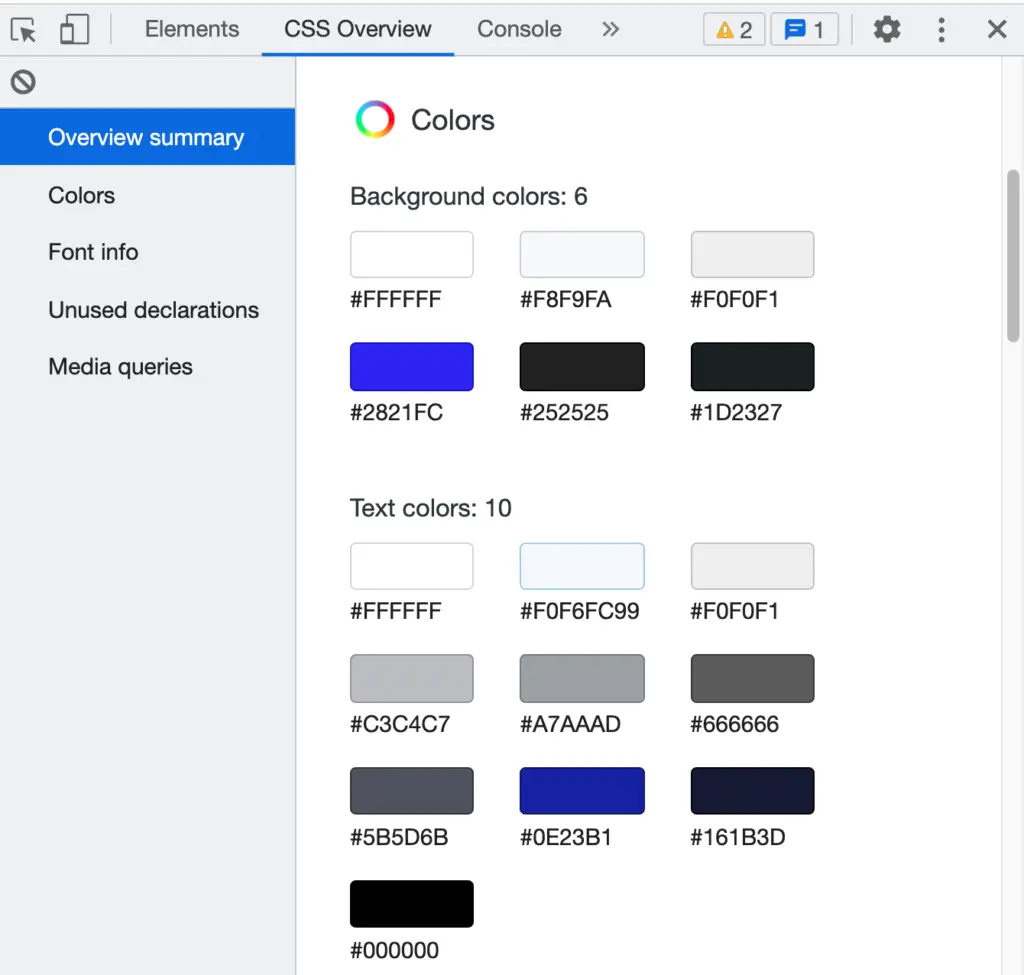
Then, click on Capture overview in the “CSS Overview” tab.
Finally, analyse the styles of your site.
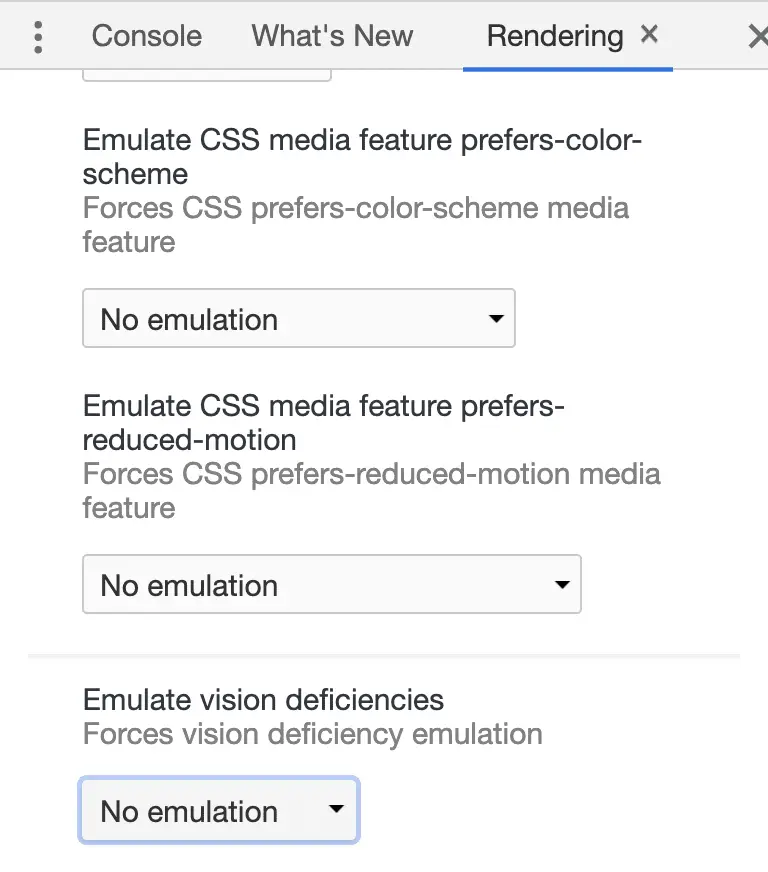
Emulate vision deficiencies
Vision deficiencies is more common that you think. Make sure that your site is accessible to everyone.
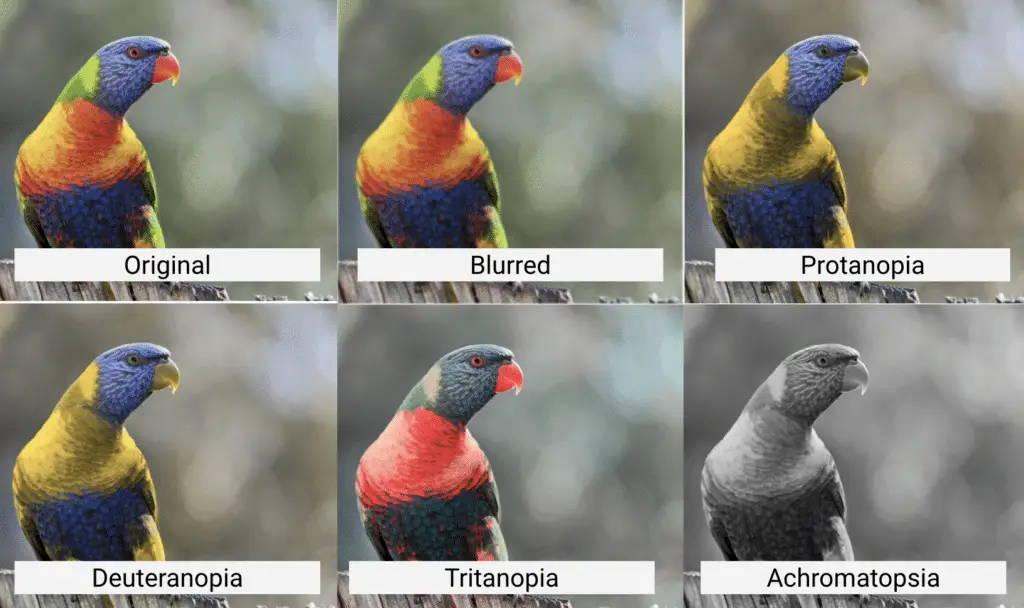
Open the Rendering Report.
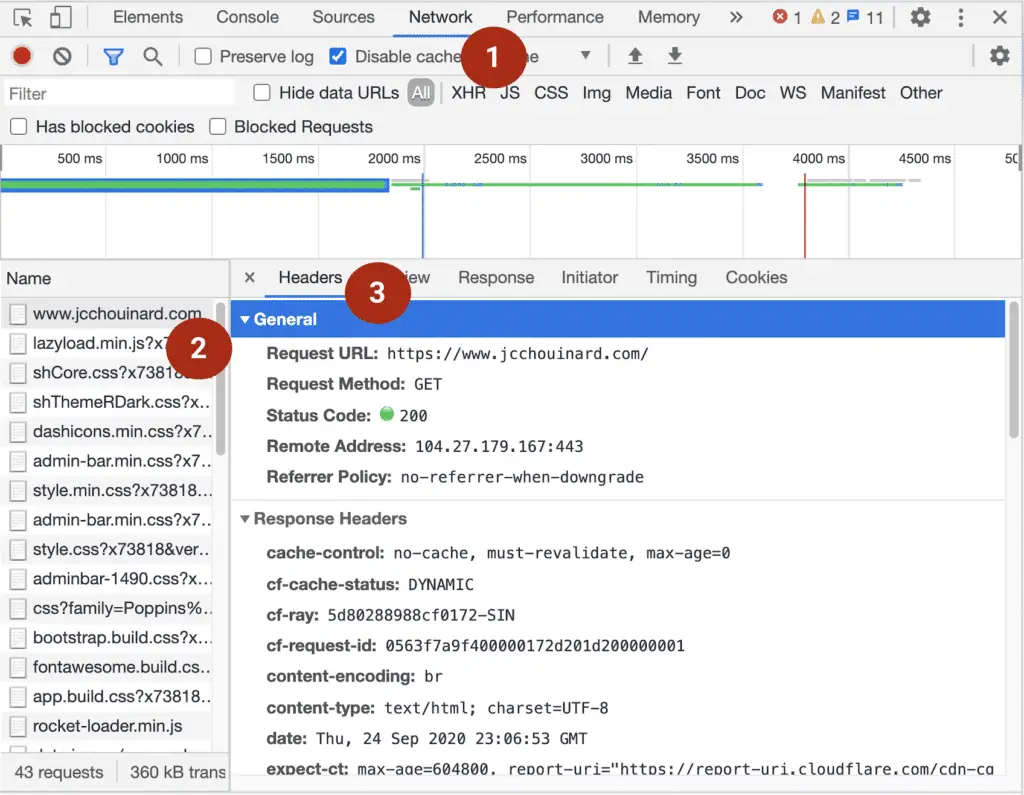
View HTTP Headers
You can view the request or response HTTP headers in Google Chrome DevTools.
- Visit a URL;
- Open Chrome Devtools:
right click, selectInspect, or;- Use ⌘ command + ⌥ option +
I(on Mac), or ; - Use
CTRL +SHIFT + I(on Windows).
- Select the
Networktab; - Reload the page;
- Select any HTTP request on the left panel, and the HTTP headers will be displayed on the right panel.
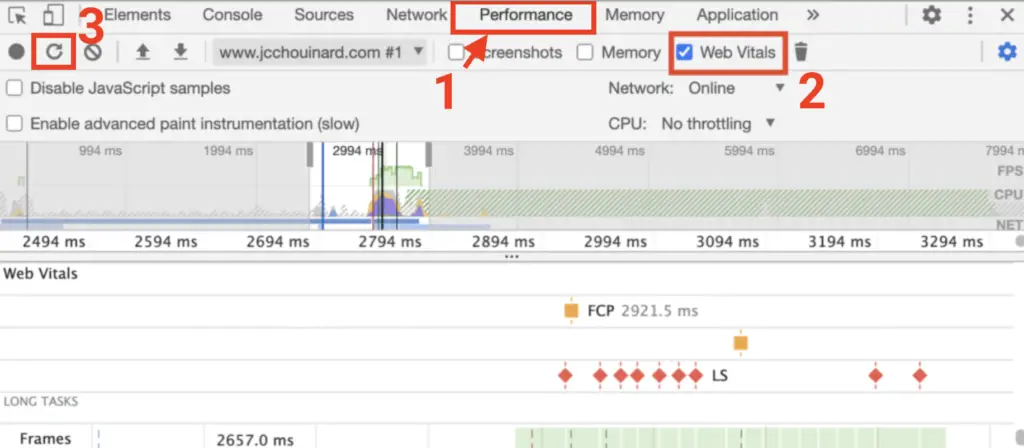
Web Vitals
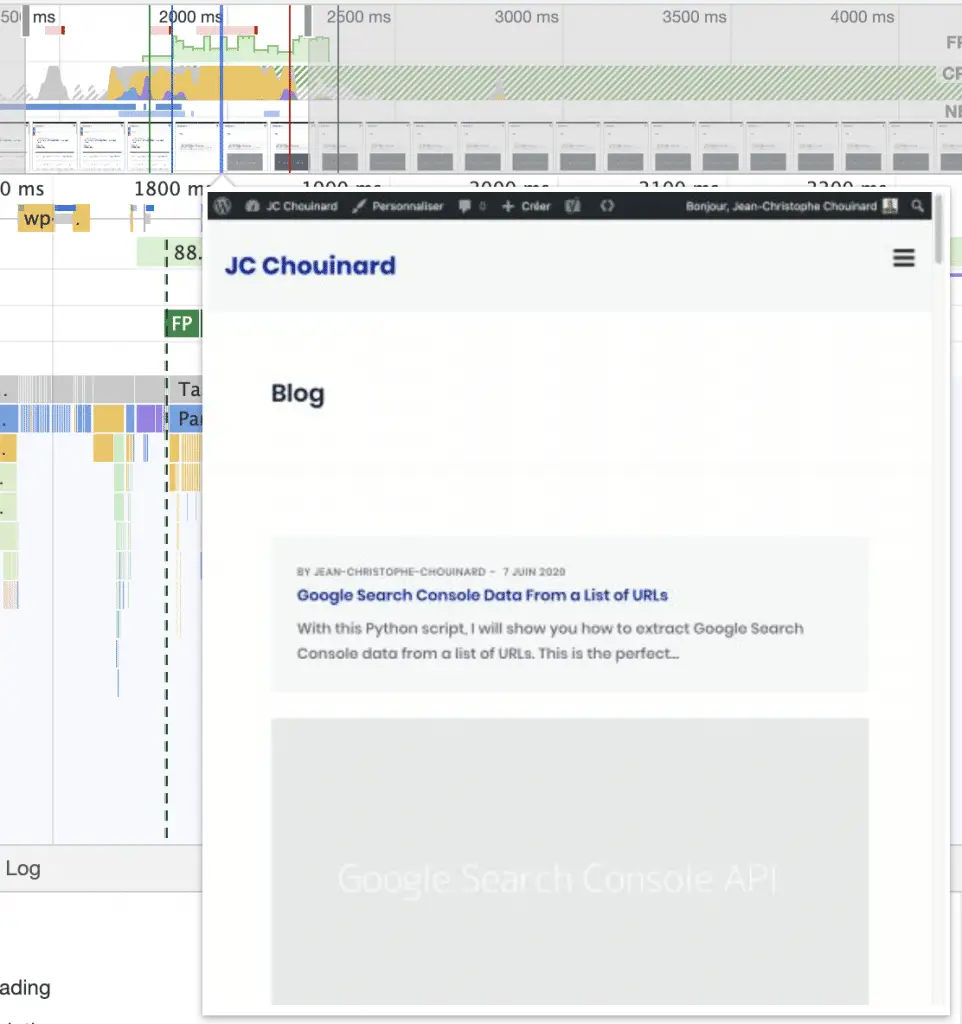
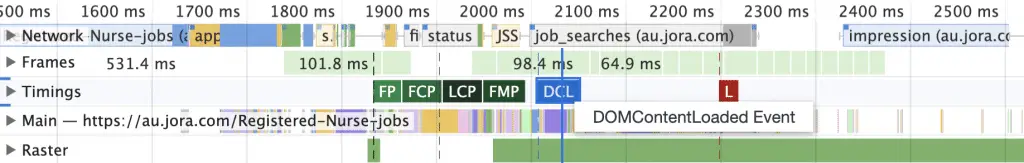
In Chrome 88, you can now check your core web vitals in the Performance Report.
Open Chrome Devtools: CMD+ SHIFT + I.
Go to Performance > select on Web Vitals > start profiling and reload page. (CMD + SHIFT + E)
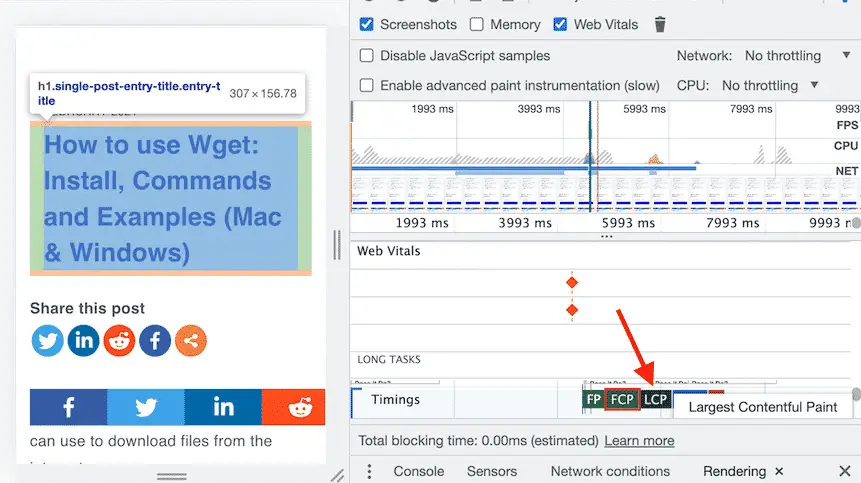
From the performance report, you can also show the Largest Contentful Paint (LCP) element in Chrome DevTools.
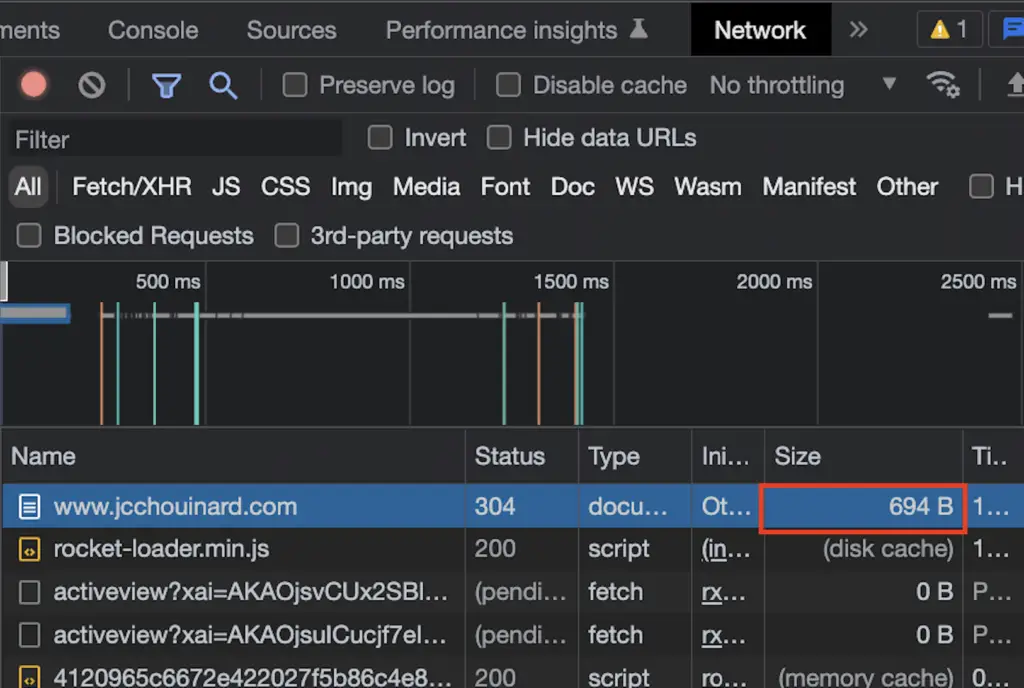
Check the Size of a Web Page
In Chrome Devtools, you can easily check the size of the HTML, or any other file, loaded on the page.
To check the size of the HTML of a page, open Chrome Devtools: CTRL+Shift+I or ⌘command+⌥ option+I.
Go to Network and reload the page.
You’ll see the size of the page in the “Size” column.
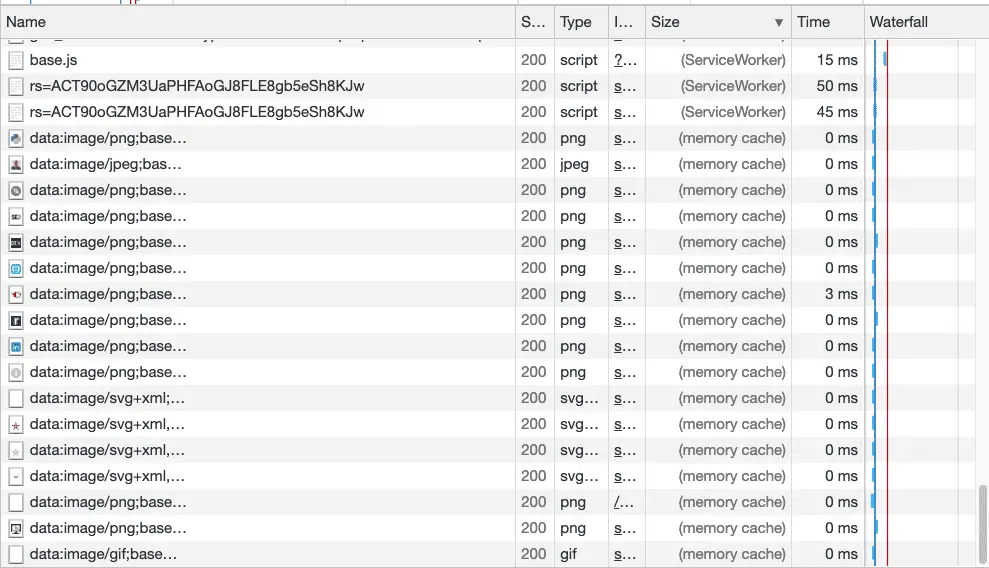
Understand the types of sizes showing:
| Size element | Description |
|---|---|
| Disk cache | Stores and loads resources from the disk |
| Memory cache | Stores and load resources from memory (RAM) |
| Prefetch cache | Resources that utilize the link prefetch mechanism to download documents using the browser idle time |
| ServiceWorker | Resources that utilize services workers to load resources before the user requests for them |
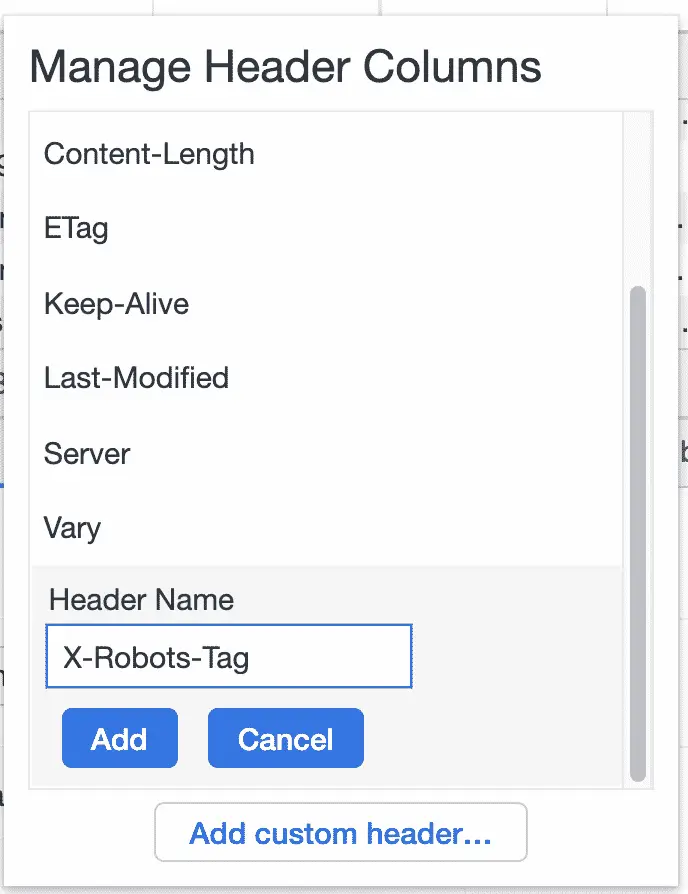
Customise Network Response Header Columns to Show X-Robots-Tag
You can add custom columns to the network report.
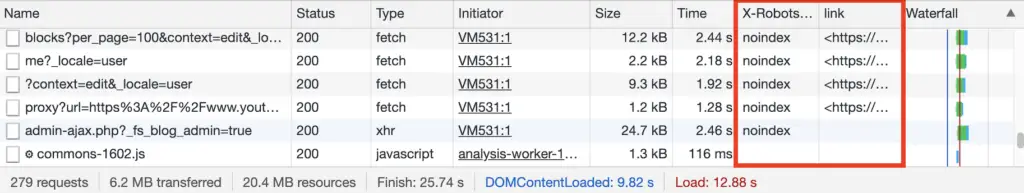
Open the Network panel and reload the page.
Right click on the columns and select Response Headers > Manage Header Columns.
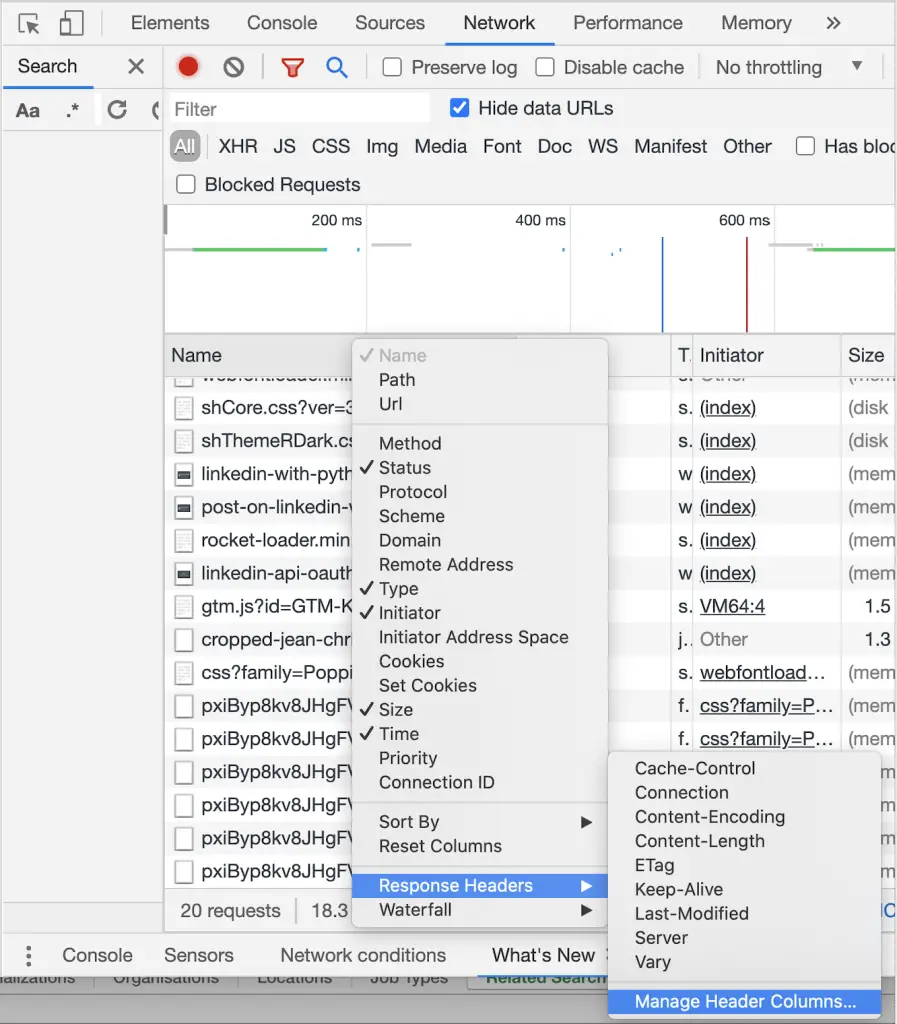
Add you custom header tag.
Check if a Website has HTTP/2 Protocol Support
Open Chrome Devtools
Open the Network panel. Reload the page.
Right click on the header > select Protocol.
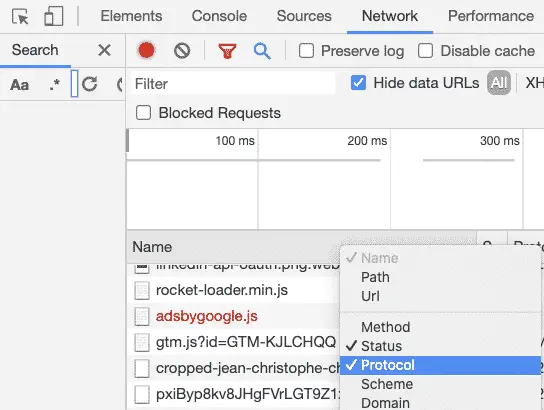
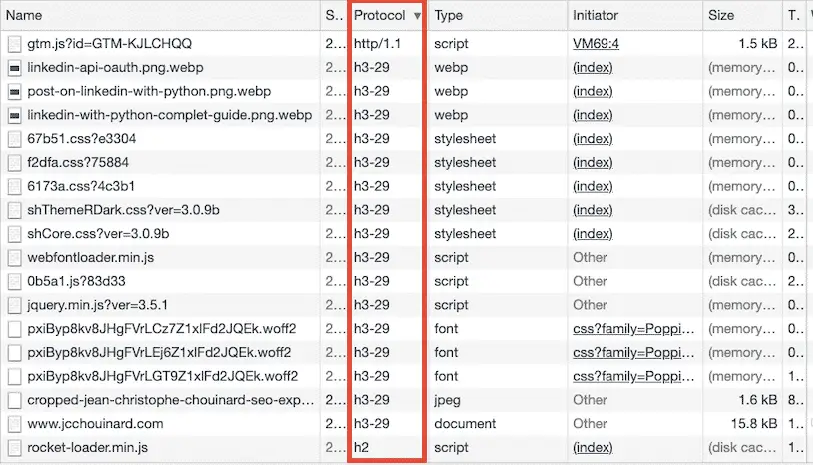
- http/1.1 = HTTP/1.1
- h2 = HTTP/2
- h3-29 = HTTP/3
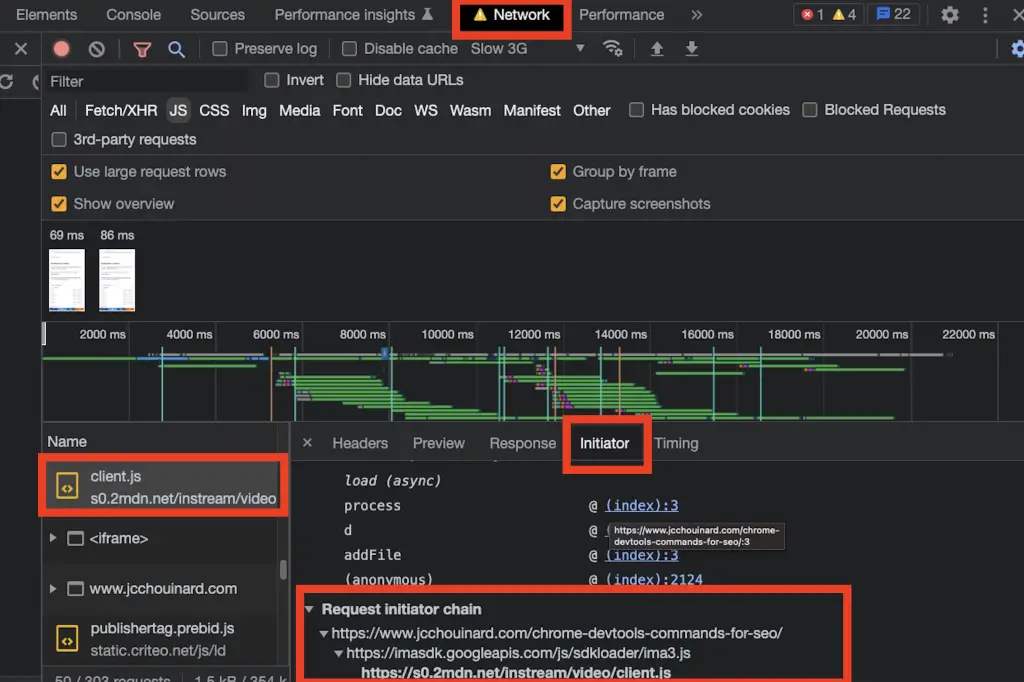
Request Initiator Chains
To view which file force the browser to load more requests in Chrome Developer tools, follow these steps:
- Go in Chrome Devtools > Network.
- Reload the page and right-click on the name of the file
- Open the initiator tab
- Scroll down the the “Request initiator chain” section
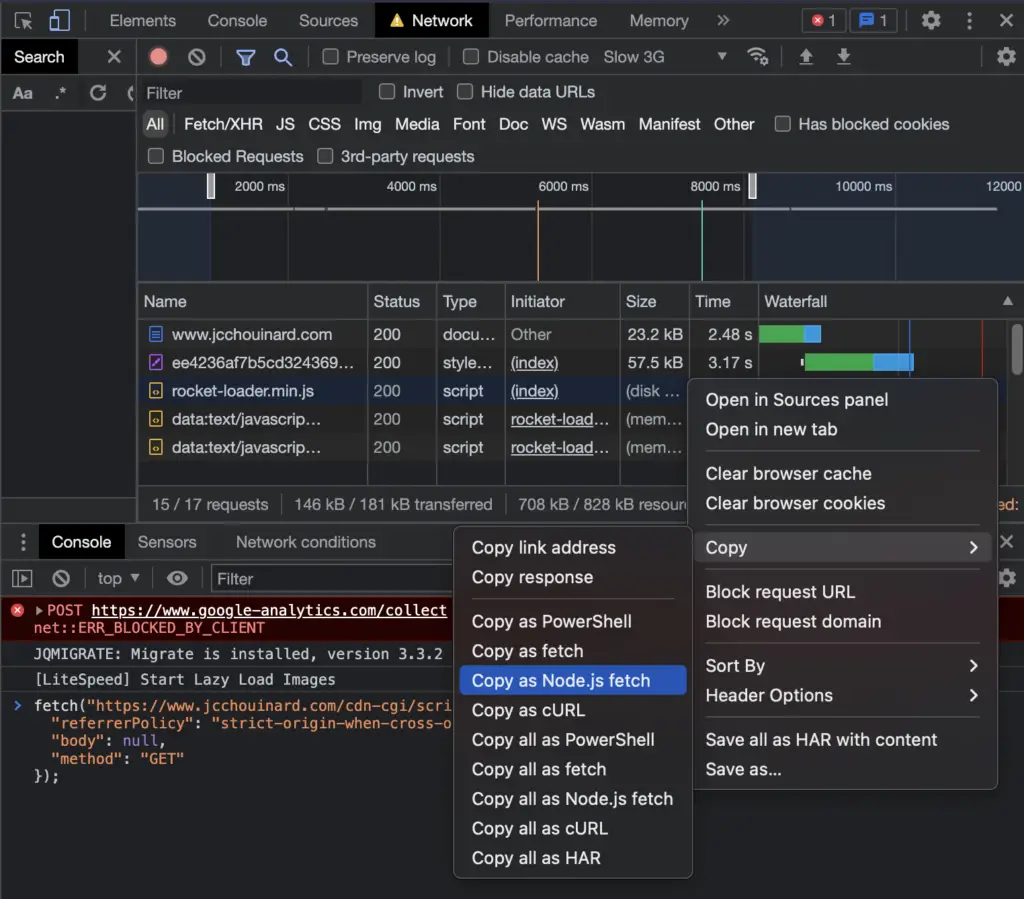
Reproduce HTTP Requests
If you want to reproduce a single request in Chrome Devtools, you can easily copy the request as a Node.js fetch or as a cURL command.
Go in Chrome Devtools > Network.
Reload the page and right-click on the request.
Move down to Copy > Copy as Node.js fetch.
If you want, you may even run the NodeJS fetch command in the same browser by copying in the Chrome JavaScript console.
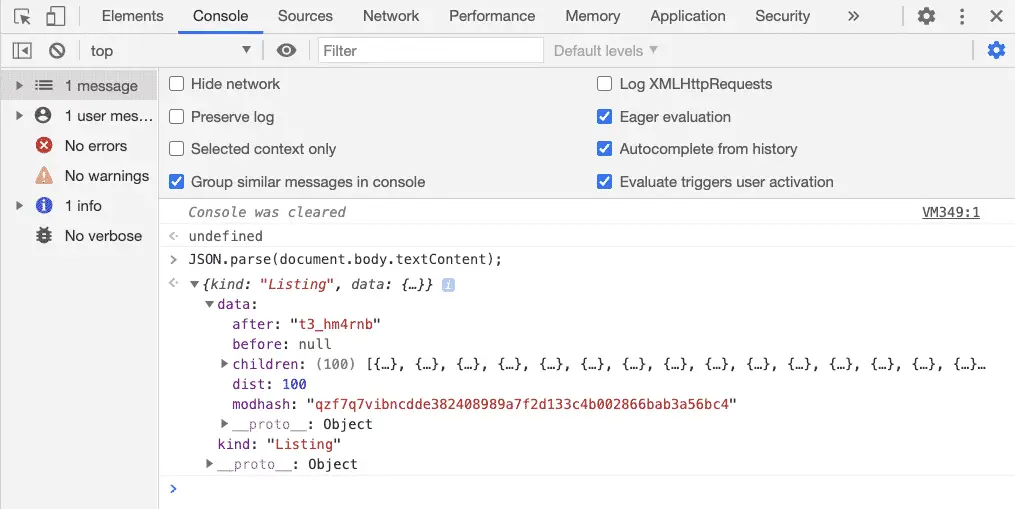
Parse JSON API Response Inside Chrome Devtools
APIs return data into a JSON format. Take the Reddit API’s JSON response for example.
Copy this URL in your browser:
https://www.reddit.com/r/python/top.json?limit=100&t=year
Then, in Chrome Devtools, open the source panel and run:
JSON.parse(document.body.textContent);
Code Snippets
Another interesting feature was shared by Erwin Hofman: the code snippets.
Code snippets let you find back often used code snippets.
Devtools > Sources > Snippets > New Snippet
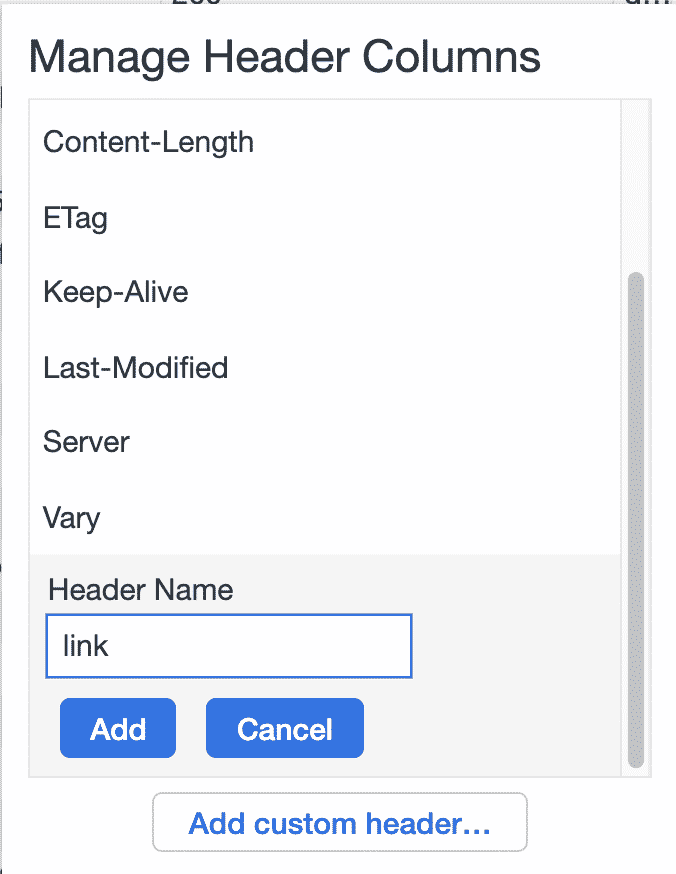
Filters
Chris Johnson (@defaced) made a fantastic presentation at BrightonSEO on Chrome Devtools. He shared a few filters that can be used to analyse your site.
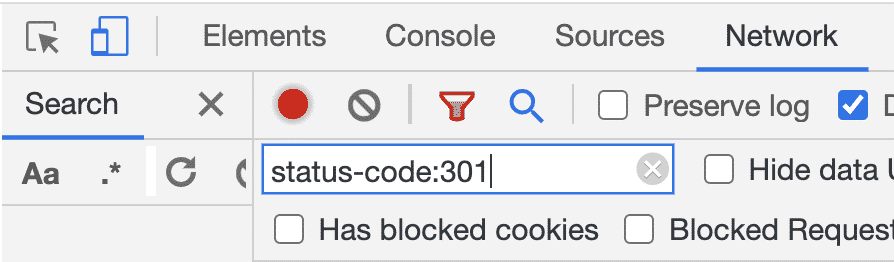
Here are a few of the filters ideas that he shared.
status-code:XXX– Show resources that returned the desired status-code.mixed-content:all– Show mixed-content issues-domain:yoursite.com– Show external requests/wp-content/plugins– Show plugins loaded on your page.
You can also filter using regex by enclosing the regex between slashes /your-regex/.
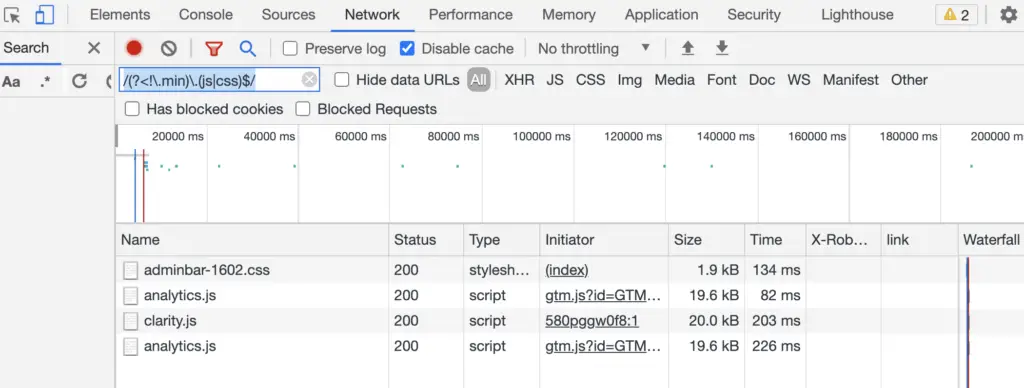
/(?<!\.min)\.(js|css)$/– Display CSS and JS that are not minified.
Also read: How to Use the DevTools Network Filter Effectively
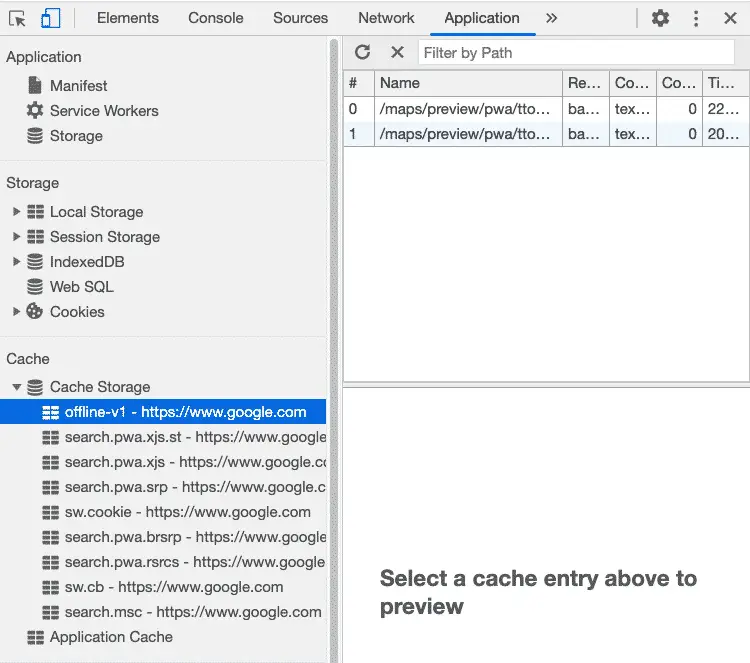
View Cached Data in Chrome Devtools
To view what is served via caching, go to:
Application > Cache Storage
Or in the network requests:
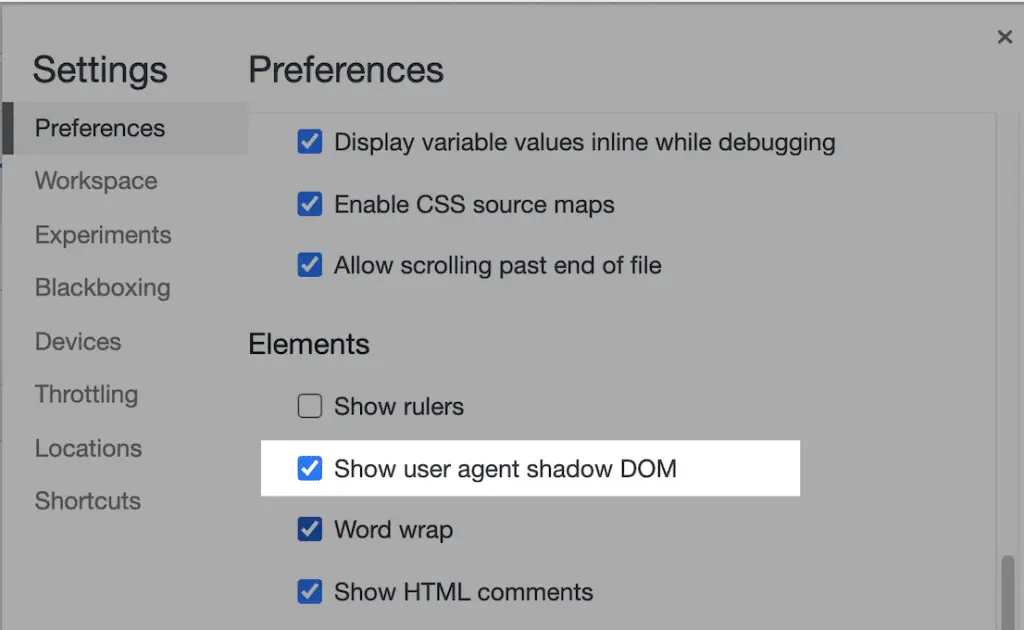
Enable Shadow DOM
Shadow DOM is complex and got a lot of discussion in the SEO community after Martin Splitt talked about it. You can view the shadow DOM by enabling it in Chrome Devtools.
Open Chrome Devtools.
Go to Settings > Preferences.
Show user agent shadow dom.
Conclusion
If you want to learn more about other programming languages, you can look at this list of python scripts for SEO.

SEO Strategist at Tripadvisor, ex- Seek (Melbourne, Australia). Specialized in technical SEO. Writer in Python, Information Retrieval, SEO and machine learning. Guest author at SearchEngineJournal, SearchEngineLand and OnCrawl.