Page Speed Insights API is a super powerful tool which can give us a lot of information to enhance our website performance. However, sometimes it gives so much information that you do not even know where to start with or on which metric you need to focus in order to improve your overall performance the most.
I strongly believe that giving an answer to these wonders is important as most likely to be able to make these improvements happen you will need to hire a developer or you will need to make the chances by yourself, which in any case poses a resources investment in terms of time or money.
For this reason, it is important to get to know which are the metrics that are going to have a higher ROI and spot those quick wins so that you can maximise the return of your investment.
Full code for this blog post is available on Github.
Example of the PageSpeed Forecasting Report
In this post, we will use Python to work with Page Speed Insights API and Lighthouse Scoring Calculator so that you will be able to answer these questions and make decisions based on the best ROI.
Woking on Large Contentful Paint would improve performance 16 points.
If you improve 50% of First Contentful Time you will improve 3 points your overall score
If you improve 50% of Speed Index you will improve 9 points your overall score
If you improve 50% of Time to interactive you will improve 1 points your overall score
If you improve 50% of Total Blocking Time you will improve 0 points your overall score
If you improve 50% of Large Contentful Paint you will improve 16 points your overall score
If you improve 50% of Cumulative Layout Shift you will improve 0 points your overall score
Let’s get it started!
What is Lighthouse Scoring Calculator?
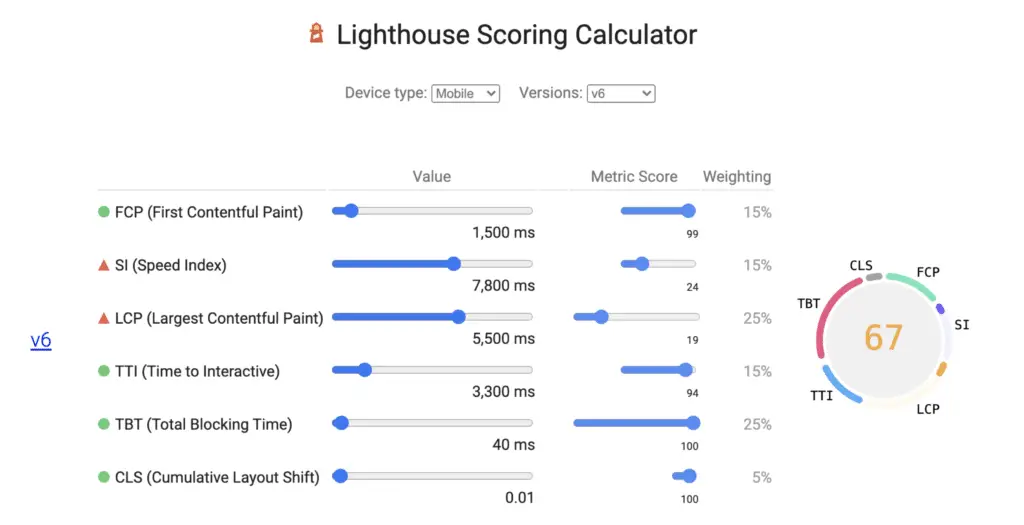
Lighthouse Scoring Calculator is a useful tool which returns the overall score that you would get from Page Speed Insights based on the given values from six metrics: First Contentful Paint, Speed Index, Largest Contentful Paint, Time to Interactive, Total Blocking Time and Cumulative Layout Shift. In this tool, you can also have the chance to choose the device you would like to simulate: mobile or desktop.
In case you use the deprecated (if I am not wrong after Lighthouse being released) Page Speed Insights version 5, instead of inputting the mentioned metrics, you would need to input First Contentful Paint, Speed Index, First Meaningful Paint, Time To Interactive and First CPU Idle metrics.
Which logic are we going to use?
Basically what we are going to do is getting from PageSpeed Insights API the metrics which are used by Lighthouse Scoring Calculator and we are going to input these metrics on Lighthouse Scoring Calculator by using the parameters and scraping the overall score. The whole process will be automated as we will use Python language and to scrape Lighthouse Scoring Calculator’s overall score we will use Selenium Webdriver.
In order to find that metric whose improvement would bring the best ROI, we will apply a 50% improvement to each of the variables separately and under ceteris paribus conditions we will check which is the variable improvement which would bring a highest overall score increment.
Automating the process with Python
1. Making a request to Page Speed Insights
To start with, we are going to make a request to Page Speed Insights API to obtain the six metrics we need to use for Lighthouse Scoring Calculator. If you are not very advanced with Page Speed Insights API, I recommend you to have a read to this article I wrote about getting the most out of Page Speed Insights API.
import urllib.request, json

device = "mobile"
page = "https://www.danielherediamejias.com/"

url = "https://www.googleapis.com/pagespeedonline/v5/runPagespeed?url=" + page + "&strategy=" + device + "&locale=en"

try:
    response = urllib.request.urlopen(url) # Recommended to use API Key
except Exception as e:
    print(e)

data = json.loads(response.read())
In the code above we make a request with urllib.request module to Page Speed Insights API for the page https://www.danielherediamejias.com/ and the mobile device.
Once the request is made, we store under the variable “data” a JSON file with the output where all the metrics are.
2. Getting and transforming the metrics to make use of them with Lighthouse Scoring Calculator
As said before, we now need to get six metrics from Page Speed Insights API response which are the ones needed for Lighthouse Scoring Calculator: First Contentful Paint, Speed Index, Largest Contentful Paint, Time to Interactive, Total Blocking Time and Cumulative Layout Shift. In addition, we can also get the overall score given by Page Speed Insights to compare it with the value that Lighthouse Scoring Calculator gives and see if they match.
The keys we can use to get these metrics from the JSON file are:
fcp_time = data["lighthouseResult"]["audits"]["first-contentful-paint"]["displayValue"]
speed_index = data["lighthouseResult"]["audits"]["speed-index"]["displayValue"]
lcp = data["lighthouseResult"]["audits"]["largest-contentful-paint"]["displayValue"]
time_interactive = data["lighthouseResult"]["audits"]["interactive"]["displayValue"]
blocking_time_duration = data["lighthouseResult"]["audits"]["total-blocking-time"]["displayValue"]
cls = data["lighthouseResult"]["audits"]["cumulative-layout-shift"]["displayValue"]
overall_score = int(data["lighthouseResult"]["categories"]["performance"]["score"] * 100)
To make these variables suitable to be used as a parameter on Lighthouse Scoring Calculator we need to make some modifications such as removing the measure units and convert them from seconds to milliseconds.
We take advantage of these modifications to create for each variable a list with the name of the metrics in the first position and the metrics in the second position. Finally, we also create a list which contains all the metrics lists.
fcp_time = ["First Contentful Time" ,int(float(fcp_time.replace("\xa0s", ""))*1000)]
speed_index = ["Speed Index", int(float(speed_index.replace("\xa0s", ""))*1000)]
time_interactive = ["Time to interactive", int(float(time_interactive.replace("\xa0s", ""))*1000)]
blocking_time_duration = ["Total Blocking Time", int(blocking_time_duration.replace("\xa0ms", ""))]
lcp = ["Large Contentful Paint", int(float(lcp.replace("\xa0s", ""))*1000)]
cls = ["Cumulative Layout Shift", round(float(cls), 2)]

list = [fcp_time, speed_index, time_interactive, blocking_time_duration, lcp, cls]
3. Our first scraping from Lighthouse Scoring Calculator with Selenium Webdriver
In this first approach to Lighthouse Scoring Calculator we are going to scrape the overall score that Lighthouse Scoring Calculator returns for the obtained metrics and compare it to the overall score that Page Speed Insights API gave us.
If you do not know how to install your Webdriver, I suggest you have a look at this article where it is very well explained.
fromseleniumimport webdriverimporttime driver=webdriver.Chrome() driver.get('https://googlechrome.github.io/lighthouse/scorecalc/#FCP='+str(list[0][1]) +'&SI='+str(list[1][1]) +'&LCP='+str(list[4][1]) +'&TTI='+str(list[2][1]) +'&TBT='+str(list[3][1]) +'&CLS='+str(list[5][1]) +'&device='+ device +'&version=6') time.sleep(3) element=driver.find_element_by_class_name("lh-gauge__percentage") finalscore=int(element.text) driver.quit()
The overall score element uses the class "lh-gauge__percentage", which is the one we use to find and scrape this element with Selenium Webdriver.
In my case, both scores match as they both return a score of 65 out of 100 (yes, I know I need to work on the mobile version of my website!). Sometimes there could be subtle differences between both scores as the Cumulative Layout Shift that we input on Lighthouse Scoring Calculator is rounded.
4. Finding the metric with the best ROI
Finally, what we are going to do is creating a “for” loop which will iterate through each of the metrics and apply a 50% improvement over the current value. We will get the difference between the current overall score and the one that we would have if we apply this 50% enhancement in that metric and store it in a list which will gather all the improvement differences.
differenceslist = []
numLoops = len(list)
'Adding a 50% increase to each metrics to check score improvement\n')f'This loop will fetch the Lighthouse {numLoops} times\n')forxinrange(numLoops):f'Testing improvement on{list[x][0]}') oldnumber=list[x][1]list[x][1]=list[x][1] -list[x][1] * 0.5 driver=webdriver.Chrome() driver.get('https://googlechrome.github.io/lighthouse/scorecalc/#FCP='+str(list[0][1]) +'&SI='+str(list[1][1]) +'&LCP='+str(list[4][1]) +'&TTI='+str(list[2][1]) +'&TBT='+str(list[3][1]) +'&CLS='+str(list[5][1]) +'&device='+ device +'&version=6') time.sleep(3) element=driver.find_element_by_class_name("lh-gauge__percentage") finalscore=int(element.text) driver.quit() differenceslist.append(finalscore-overall_score)list[x][1]=oldnumber
Finally, we can use something like this to print the overall score growth that we would get in case we improve 50% each of the metrics and the metric that would bring the best ROI:
print("\nWoking on " + str(list[differenceslist.index(max(differenceslist))][0]) + " would improve performance " + str(max(differenceslist)) + " points." )
for x in range (len(differenceslist)):
    print("If you improve 50% of " + str(list[x][0]) + " you will improve " + str(differenceslist[x]) + " points your overall score")

In my case it is pretty clear that I need to focus on the Largest Contentful Paint for mobile, if I manage to improve 50% of the current performance I will enhance my overall score in 20 points, from 65 to 85 points. I will start working on it as soon as possible!

SEO Platform Owner at Betsson | SEO Consultant Freelancer | Masters in SEO & SEM