The confusion matrix is often used in machine learning to compute the accuracy of a classification algorithm.
It can be used in binary classifications as well as multi-class classification problems.
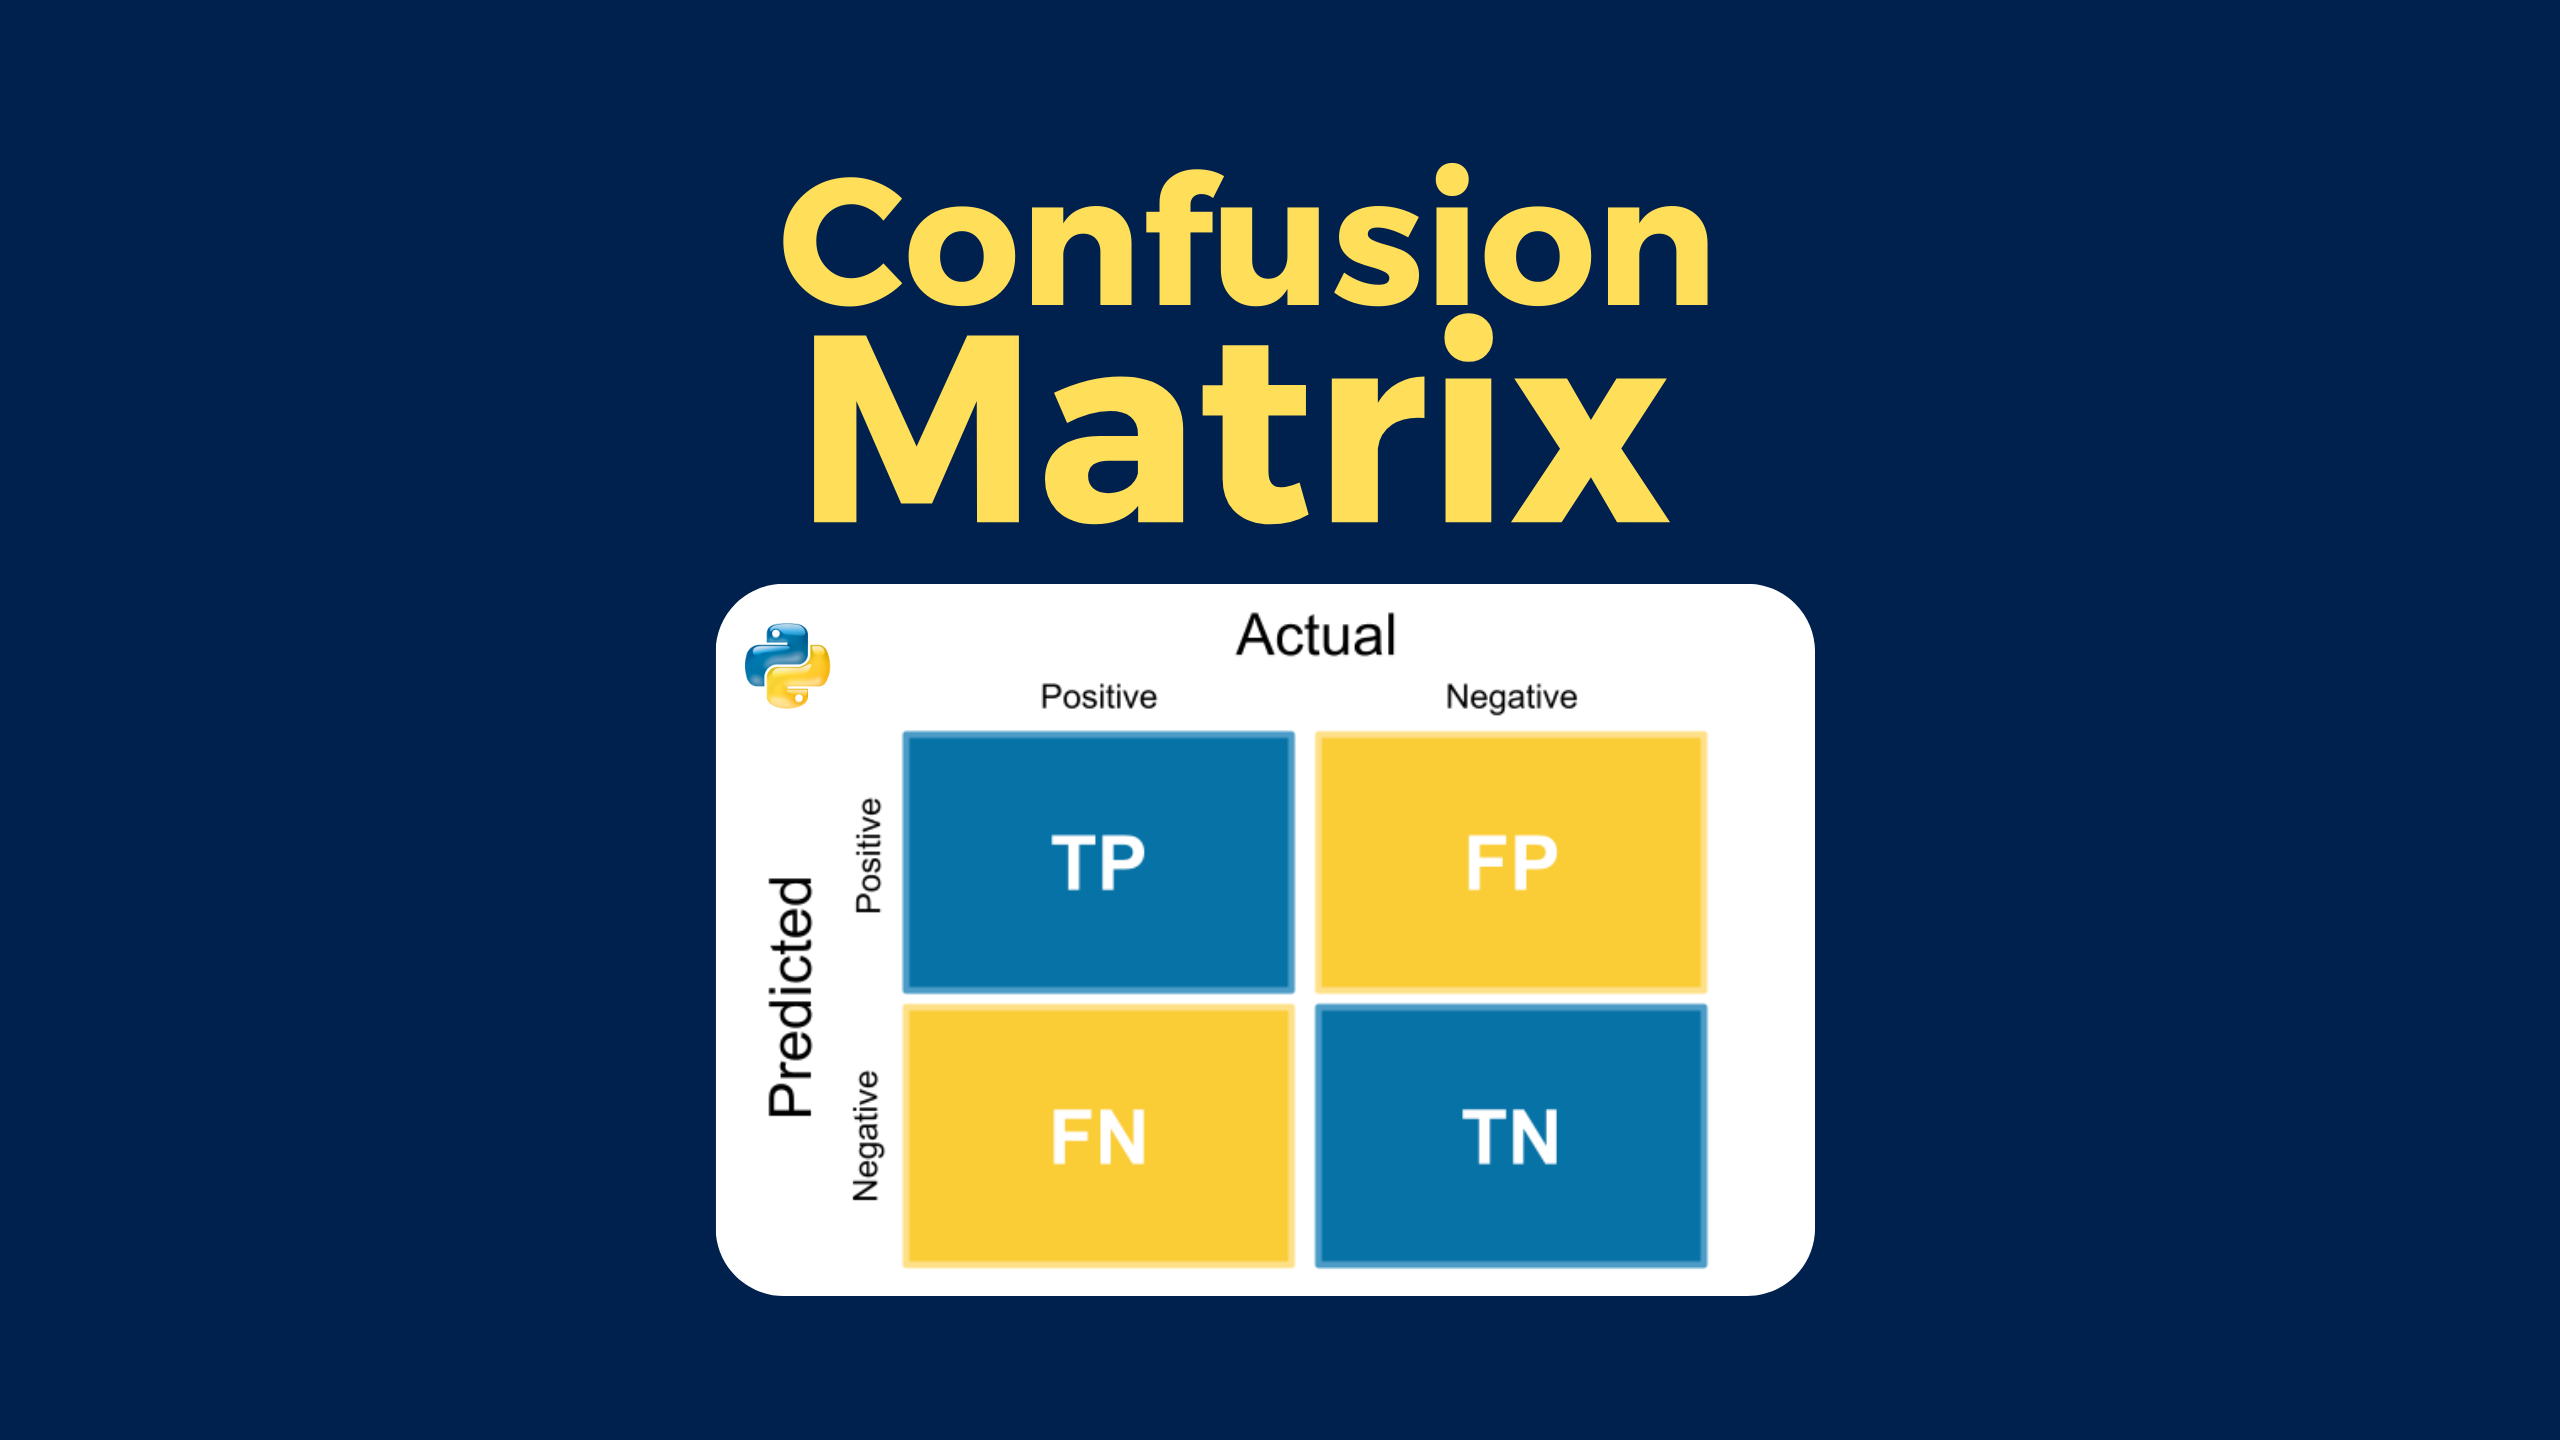
Confusion Matrix
A confusion matrix is a visual representation of the performance of a machine learning model. It summarizes the predicted and actual values of a classification model to identify misclassifications. The confusion matrix helps data scientists to fine-tune their models and improve their performance.
What the Confusion Matrix Measures?
It measures the quality of predictions from a classification model by looking at how many predictions are True and how many are False.
Specifically, it computes:
- True positives (TP)
- False positives (FP)
- True negatives (TN)
- False negatives (FN)
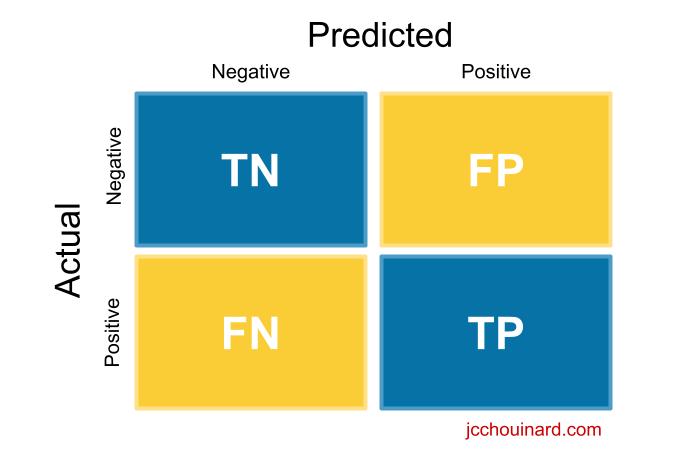
Understand the Confusion Matrix
Here, we will try to make sense of the true positive, true negative, false positive and false negative values mean.
True Positive (TP)
The model predicted true and it is true.
The model predicted that someone is sick and the person is sick.
True Negative (TN)
The model predicted false and it is false.
The model predicted that someone is not sick and the person is not sick.
False Positive (FP)
The model predicted True and it is false.
The model predicted that someone is sick and the person is not sick.
False Negative (FN)
The model predicted false and it is true.
The model predicted that someone is not sick and the person is sick.
How to Create a Confusion Matrix with Python in Scikit-learn?
In order to get a confusion matrix in scikit-learn:
- Run a classification algorithm
classifier.fit(X_train, y_train)
y_pred = classifier.predict(X_test)
- Import metrics from the sklearn module
from sklearn.metrics import confusion_matrix

- Run the confusion matrix function on actual and predicted values
confusion_matrix(y_test, y_pred)

- Plot the confusion matrix
plot_confusion_matrix(classifier, X_test, y_test, cmap=plt.cm.Blues)
plt.show()
- Inspect the classification report
print(classification_report(y_test, y_pred))

Run a Classification Algorithm in Python
In a previous article, we classified breast cancers using the k-nearest neighbors algorithm from scikit-learn.
I will not explain this part of the code, but you can look at the detail in the article on the k-nearest neighbors.
import pandas as pd
from sklearn.datasets import load_breast_cancer
from sklearn.neighbors import KNeighborsClassifier
from sklearn.model_selection import train_test_split

def to_target(x):
    """Map targets to target names"""
    return list(dataset.target_names)[x]

# Load data
dataset = load_breast_cancer()
df = pd.DataFrame(dataset.data,columns=dataset.feature_names)
df['target'] = pd.Series(dataset.target)
df['target_names'] = df['target'].apply(to_target)


# Define predictor and predicted datasets
X = df.drop(['target','target_names'], axis=1).values
y = df['target_names'].values

# split taining and test set
X_train, X_test, y_train, y_test = train_test_split(X, y, test_size=0.3, random_state=42, stratify=y)

# train the model
knn = KNeighborsClassifier(n_neighbors=8)
knn.fit(X_train, y_train)
y_pred = knn.predict(X_test)

# compute accuracy of the model
knn.score(X_test, y_test)
The result is an accuracy score of the model.
0.9239766081871345
Create a Confusion Matrix in Python
Use the confusion_matrix method from sklearn.metrics to compute the confusion matrix.
from sklearn.metrics import confusion_matrix

cm = confusion_matrix(y_test,y_pred)
cm
The result is an array in which positions are the same as the quadrant we saw in the past.
array([[ 57,   7],
       [  5, 102]])
cm[0][0]= TPcm[1][1]= TNcm[0][1]= FPcm[1][0]= FN
Plot the Confusion Matrix in Scikit-Learn
You can use the plot_confusion_matrix method to visualize the confusion matrix.
import matplotlib.pyplot as plt
from sklearn.metrics import plot_confusion_matrix

color = 'white'
matrix = plot_confusion_matrix(knn, X_test, y_test, cmap=plt.cm.Blues)
matrix.ax_.set_title('Confusion Matrix', color=color)
plt.xlabel('Predicted Label', color=color)
plt.ylabel('True Label', color=color)
plt.gcf().axes[0].tick_params(colors=color)
plt.gcf().axes[1].tick_params(colors=color)
plt.show()
The result is your confusion matrix plot.
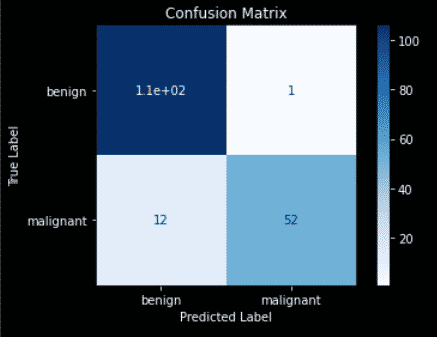
- Top left quadrant = True Positives = Number of benign labelled as benign
- Bottom right quadrant = True Negatives = Number of malignant labelled as malignant
- Top right quadrant = False Positives = Number of benign labelled as malignant
- Bottom left quadrant = False Negatives = Number of malignant labelled as benign
You may run into this error:
ImportError: cannot import name 'plot_confusion_matrix' from 'sklearn.metrics'
Or the following FutureWarning:
FutureWarning: Function plot_confusion_matrix is deprecated; Function `plot_confusion_matrix` is deprecated in 1.0 and will be removed in 1.2. Use one of the class methods: ConfusionMatrixDisplay.from_predictions or ConfusionMatrixDisplay.from_estimator.
  warnings.warn(msg, category=FutureWarning)
This is because plot_confusion_matrix was deprecated in some release.
The alternative is to use ConfusionMatrixDisplay.
import matplotlib.pyplot as plt
from sklearn.metrics import ConfusionMatrixDisplay
from sklearn.metrics import confusion_matrix

cm = confusion_matrix(y_test, y_pred, labels=knn.classes_)
color = 'white'
disp = ConfusionMatrixDisplay(confusion_matrix=cm, display_labels=knn.classes_)
disp.plot()
plt.show()
Run the Classification Report in Python
With data from the confusion matrix, you can interpret the results by looking at the classification report.
from sklearn.metrics import classification_report

print(classification_report(y_test, y_pred))
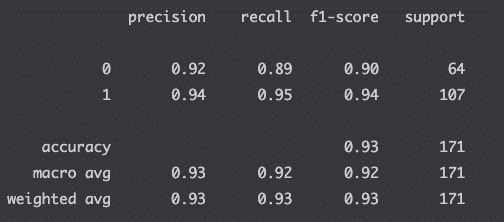
The report returns the metrics relevant to evaluating your classification model:
| Metric | What it is | Sklearn’s Metric Method |
|---|---|---|
| Accuracy | (true positive + true negative) / total predictions | metrics.precision_score(true, pred) |
| Precision | true positive / (true positive + false positive) | metrics.precision_score(true, pred) |
| Recall (sensitivity) | true positive / (true positive + false negative) | metrics.recall_score(true, pred) |
| F1-Score | 2 * (precision * recall) / (precision + recall) | metrics.f1_score(true, pred) |
| Specificity | true negative / (true negative + false positive) | metrics.recall_score(true, pred, pos_label=0) |
If you don’t understand the result above, make sure that you read the article that I wrote on the classification report.
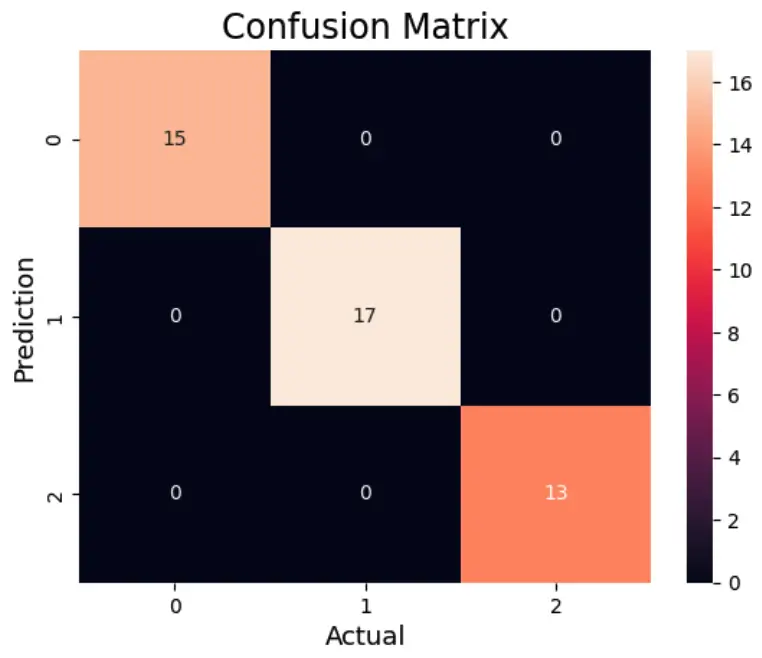
Confusion Matrix for Multi-Class Classification
#Import the necessary libraries
from sklearn.datasets import load_wine
from sklearn.model_selection import train_test_split
from sklearn.ensemble import RandomForestClassifier
from sklearn.metrics import confusion_matrix
import seaborn as sns
import matplotlib.pyplot as plt
from sklearn.metrics import accuracy_score

# Load the wine dataset
X, y = load_wine(return_X_y=True)
X_train, X_test, y_train, y_test = train_test_split(X, y,test_size=0.25)

# Train the model
clf = RandomForestClassifier(random_state=23)
clf.fit(X_train, y_train)

# Predict using the test data
y_pred = clf.predict(X_test)

# Compute the confusion matrix
cm = confusion_matrix(y_test,y_pred)

# Plot the confusion matrix.
sns.heatmap(cm,
            annot=True)
plt.ylabel('Prediction',fontsize=13)
plt.xlabel('Actual',fontsize=13)
plt.title('Confusion Matrix',fontsize=17)
plt.show()

# Calculate accuracy
accuracy = accuracy_score(y_test, y_pred)
print("Accuracy   :", accuracy)
Confusion Matrix Definitions
| Confusion Matrix | Quality measurement of predictions |
| Scikit-learn | Machine learning package in Python |
| True positive | Model correctly predicts the positive class |
| False positive | Model incorrectly predicts the positive class |
| True negative | Model correctly predicts the negative class |
| False negative | Model incorrectly predicts the negative class |
Cheatsheet
| Install sklearn | pip install -U scikit-learn |
| Python library import | from sklearn.metrics import confusion_matrix |
| Plot confusion matrix | sklearn metrics plot_confusion_matrix |
| Classification report | sklearn metrics classification_report |
Confusion Matrix Parameters
Here are the parameters that can be used with the confusion_matrix() function in Scikit-learn.
confusion_matrix(y_true, y_pred, *, labels=None, sample_weight=None, normalize=None)- y_true: Ground truth (correct) target values.
array-like of shape (n_samples,) - y_pred: Estimated targets as returned by a classifier.
array-like of shape (n_samples,) - labels: List of labels to index the matrix. This may be used to reorder or select a subset of labels. If
Noneis given, those that appear at least once iny_trueory_predare used in sorted order.array-like of shape (n_classes), default=None - sample_weight: Sample weights.
array-like of shape (n_samples,), default=None - normalize : Normalizes confusion matrix over the true (rows), predicted (columns) conditions or all the population. If
None, confusion matrix will not be normalized.{'true', 'pred', 'all'}, default=None
Confusion Matrix FAQs
Run a classification algorithm, import the confusion matrix function from the sklearn.metrics module, run function on test and prediction and plot the matrix.
use the confusion matrix to evaluate the performance of a machine learning classification algorithm.
The confusion matrix provides more insights into a model’s performance than classification accuracy as it shows the number of correctly and incorrectly classified instances.
Confusion matrices shows the accuracy of the prediction of classes. When trying to predict a number output like in the case of the continuous output of a regression model, confusion matrix should not be used.
The confusion matrix is used to evaluate the accuracy of a machine learning model that tries to predict classes (e.g. Classification).
Use the confusion_matrix function from the sklearn.metrics module.
No. Confusion matrix can be used for binary classification as well as multi-class classification problems.
Conclusion
This article was quite big to grasp.
All I want you to leave with is that it is super important to look at the confusion matrix to help you fine-tune your machine learning models.
This can modify the accuracy score quite heavily in some cases.
Good work on building your first confusion matrix in Scikit-learn.

SEO Strategist at Tripadvisor, ex- Seek (Melbourne, Australia). Specialized in technical SEO. Writer in Python, Information Retrieval, SEO and machine learning. Guest author at SearchEngineJournal, SearchEngineLand and OnCrawl.