Evaluate the results of an SEO experiment on your site using Google Search Console and CausalImpact with Python.
In this tutorial, we will learn how to use the pyCausalImpact python wrapper on Google Search Console data in two ways:
- Using simple CSV files
- Using the google search console API
CausalImpact is a package created by Kay H. Brodersen that uses Bayesian statistics to infer the causal effect of an event.
Navigation
Show
How to format your data for CausalImpact
CausalImpact can be used in two ways:
- Simple pre-post experiment
- Using control groups
Simple pre-post experiment
Your dataset should be a table with dates and a single y column.
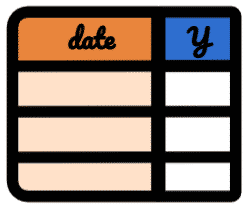
- The
datecolumn - The
ycolumn contains data from a single site.
With Google Search Console, the
ycolumn could contain clicks, impressions, CTR or position.
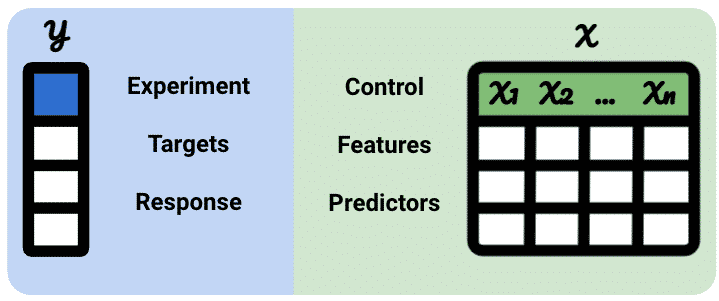
Using control groups
When comparing against control groups, your dataset should be a table like this:

datesycolumn containing data from the sites which you tested onXncolumns containing data from the sites/subfolders which the test was not turned on. EachXcolumn represents a different feature.
In Google Search Console,
ycould contain clicks fromSite A, the X1 column could contain clicks fromSite Band X2, clicks fromSite C.
Defining test and control groups
Control groups in causal inference are datasets that are not impacted by an experiment than can used to improve the prediction on your test data.
Control groups can be different things:
- Independent data such as search trends of a topic in Google Trends
- Different TLD (
example1.com,example2.com) - Different ccTLD (
example.com,example.ca) - Different subdomains (
ca.example.com,au.example.com) - Different subfolders (
example.com/ca,example.com/au)
By convention, the test group is usually labelled as y and the control groups as X.
Getting Started
First, you will need to install Python and install some packages.
$ pip install pycausalimpact
$ pip install searchconsole
Run Causal Impact with Python on Extracted GSC data
The simplest way to load Google Search Console data is through a simple export in the performance report.
Load Search Console data

And then load the data with pandas and define your parameters.
import pandas as pd

X = pd.read_csv('control_gsc_data.csv')
y = pd.read_csv('test_gsc_data.csv')

# define metric that you want to test
# impressions, clicks, ctr
metric = 'clicks'

# define intervention data
intervention = '2021-08-01'
Execute Causal Impact
from causalimpact import CausalImpact

def get_pre_post(data):
    """Get pre-post periods based on the intervention date

    Args:
        data (dataframe): df comming from create_master_df()

    Returns:
        tuple: tuple of lists showing index edges of period before and after intervention
    """
    pre_start = min(data.index)
    pre_end = int(data[data['date'] == intervention].index.values)
    post_start = pre_end + 1
    post_end = max(data.index)

    pre_period = [pre_start, pre_end]
    post_period = [post_start, post_end]
    return pre_period, post_period


def make_report(data, pre_period, post_period):
    """Creates the built-in CausalImpact report

    Args:
        data (dataframe): df comming from create_master_df()
        pre_period (list): list coming from get_pre_post()
        post_period (list): list coming from get_pre_post()
    """
    ci = CausalImpact(data.drop(['date'], axis=1), pre_period, post_period)
    print(ci.summary())
    print(ci.summary(output='report'))
    ci.plot()


if __name__ == '__main__':
    y = y[['date', metric]].rename(columns={metric:'y'})
    X = X[['date', metric]].rename(columns={metric:'X'})
    data = y.merge(X, on='date', how='left')
    data.sort_values(by='date').reset_index(drop=True)
    pre_period, post_period = get_pre_post(data)
    make_report(data, pre_period, post_period)
Run Causal Impact with GSC API
Get your credentials file
To use the Google Search Console API, you will need to get your Google Search Console credentials and save them into a client_secrets.json file.
Authenticate
Then, you will need to authenticate.
import searchconsole

def authenticate(config='client_secrets.json', token='credentials.json'):
    """Authenticate GSC"""
    if os.path.isfile(token):
        account = searchconsole.authenticate(client_config=config,
                                            credentials=token)
    else:
        account = searchconsole.authenticate(client_config=config,
                                        serialize=token)
    return account

account = authenticate()
At this stage, your browser will open and ask you to authenticate the API.
Create the class to process data
from causalimpact import CausalImpact
from functools import reduce
import numpy as np
import pandas as pd
import searchconsole


class Causal:


    def __init__(self, account, intervention, test_sites, control_sites='', months=-16, metric='clicks', dimension='date'):
        self.account = account
        self.test_sites = test_sites
        self.control_sites = control_sites if control_sites else None
        self.intervention = intervention
        self.metric = metric
        self.months = months
        self.dimension = dimension


    def run_causal(self):
        """Combines all the functions together

        Returns:
            [df]: dataframe on which CI was run
        """
        data = self.create_master_df()
        pre_period, post_period = self.get_pre_post(data)
        self.make_report(data, pre_period, post_period)
        return data


    def extract_from_list(self, sites):
        """Extract GSC data from a list of sites

        Args:
            sites (list): list of properties validated in GSC

        Returns:
            [list]: List of dataframes extracted from GSC
        """
        print(f'Extracting data for {sites}')
        dfs = []
        for site in sites:
            print(f'Extracting: {site}')
            webproperty = self.account[site]
            report = webproperty.query\
                    .range('today', months=self.months)\
                    .dimension(self.dimension)\
                    .get()
            df = report.to_dataframe()
            dfs.append(df)
        return dfs


    def concat_test(self, dfs):
        """Concatenate the dataframes used for testing

        Args:
            dfs (list): List of dataframes extracted from GSC

        Returns:
            dataframe: merged test dataframes summed together
        """
        concat_df = pd.concat(dfs)
        test = concat_df.groupby('date')[['clicks', 'impressions']].sum()
        test = test.reset_index()
        test['ctr'] = test['clicks'] / test['impressions']
        return test


    def concat_control(self, dfs):
        """Concatenate the dataframes used for control

        Args:
            dfs (list): List of dataframes extracted from GSC

        Returns:
            dataframe: merged control dataframes. 1 metric column by df
        """
        control_data = []
        for i in range(len(dfs)):
            df = dfs[i][['date', self.metric]]
            df = df.rename(columns={self.metric: f'X{i}'})
            control_data.append(df)
        control = reduce(
                lambda left, right: pd.merge(
                        left, right, on=['date'],
                        how='outer'),
                control_data
                )
        return control


    def create_master_df(self):
        """Create a master df for a given metric with:
        y = test (target)
        Xn = control (features)

        Returns:
            dataframe: df with target and features based on list of sites
        """
        test = self.extract_from_list(self.test_sites)
        test = self.concat_test(test)
        y = test[['date', self.metric]].rename(columns={self.metric:'y'})

        if self.control_sites:
            control = self.extract_from_list(self.control_sites)
            X = self.concat_control(control)
            data = y.merge(X, on='date', how='left')
        else:
            data = y
        return data.sort_values(by='date').reset_index(drop=True)


    def get_pre_post(self, data):
        """Get pre-post periods based on the intervention date

        Args:
            data (dataframe): df comming from create_master_df()

        Returns:
            tuple: tuple of lists showing index edges of period before and after intervention
        """
        pre_start = min(data.index)
        pre_end = int(data[data['date'] == self.intervention].index.values)
        post_start = pre_end + 1
        post_end = max(data.index)

        pre_period = [pre_start, pre_end]
        post_period = [post_start, post_end]
        return pre_period, post_period


    def make_report(self, data, pre_period, post_period):
        """Creates the built-in CausalImpact report

        Args:
            data (dataframe): df comming from create_master_df()
            pre_period (list): list coming from get_pre_post()
            post_period (list): list coming from get_pre_post()
        """
        ci = CausalImpact(data.drop(['date'], axis=1), pre_period, post_period)
        print(ci.summary())
        print(ci.summary(output='report'))
        ci.plot()
Define the variables
# define metric that you want to test
# impressions, clicks, ctr
metric = 'clicks'

# define intervention data
intervention = '2021-08-01'

# give the path of your credential file
client_secrets = 'client_secrets.json'

# define sites on which you ran the experiment (required)
test_sites = [
    'https://ca.example.com/',
    'https://us.example.com/',
    'https://au.example.com/'
    ]

# define control sites that were not shown the experiment (optional)
# set list as empty [] to run simple pre-post experiment
control_sites = [
    'https://www.example.fr/',
    'https://uk.example.com/'
    ]
Run the code
if __name__ == '__main__':
    account = authenticate(config=client_secrets)
    c = Causal(
        account,
        intervention,
        test_sites,
        control_sites=control_sites,
        metric='clicks')
    c.run_causal()
Full code
from causalimpact import CausalImpact
from functools import reduce
import numpy as np
import os
import pandas as pd
import searchconsole

# define metric that you want to test
# impressions, clicks, ctr
metric = 'clicks'

# define intervention data
intervention = '2021-08-01'

# give the path of your credential file
client_secrets = 'client_secrets.json'

# define sites on which you ran the experiment (required)
test_sites = [
    'https://ca.example.com/',
    'https://us.example.com/',
    'https://au.example.com/'
    ]

# define control sites that were not shown the experiment (optional)
# set list as empty [] to run simple pre-post experiment
control_sites = [
    'https://www.example.fr/',
    'https://uk.example.com/'
    ]


class Causal:


    def __init__(self, account, intervention, test_sites, control_sites='', months=-16, metric='clicks', dimension='date'):
        self.account = account
        self.test_sites = test_sites
        self.control_sites = control_sites if control_sites else None
        self.intervention = intervention
        self.metric = metric
        self.months = months
        self.dimension = dimension


    def run_causal(self):
        """Combines all the functions together

        Returns:
            [df]: dataframe on which CI was run
        """
        data = self.create_master_df()
        pre_period, post_period = self.get_pre_post(data)
        self.make_report(data, pre_period, post_period)
        return data


    def extract_from_list(self, sites):
        """Extract GSC data from a list of sites

        Args:
            sites (list): list of properties validated in GSC

        Returns:
            [list]: List of dataframes extracted from GSC
        """
        print(f'Extracting data for {sites}')
        dfs = []
        for site in sites:
            print(f'Extracting: {site}')
            webproperty = self.account[site]
            report = webproperty.query\
                    .range('today', months=self.months)\
                    .dimension(self.dimension)\
                    .get()
            df = report.to_dataframe()
            dfs.append(df)
        return dfs


    def concat_test(self, dfs):
        """Concatenate the dataframes used for testing

        Args:
            dfs (list): List of dataframes extracted from GSC

        Returns:
            dataframe: merged test dataframes summed together
        """
        concat_df = pd.concat(dfs)
        test = concat_df.groupby('date')[['clicks', 'impressions']].sum()
        test = test.reset_index()
        test['ctr'] = test['clicks'] / test['impressions']
        return test


    def concat_control(self, dfs):
        """Concatenate the dataframes used for control

        Args:
            dfs (list): List of dataframes extracted from GSC

        Returns:
            dataframe: merged control dataframes. 1 metric column by df
        """
        control_data = []
        for i in range(len(dfs)):
            df = dfs[i][['date', self.metric]]
            df = df.rename(columns={self.metric: f'X{i}'})
            control_data.append(df)
        control = reduce(
                lambda left, right: pd.merge(
                        left, right, on=['date'],
                        how='outer'),
                control_data
                )
        return control


    def create_master_df(self):
        """Create a master df for a given metric with:
        y = test (target)
        Xn = control (features)

        Returns:
            dataframe: df with target and features based on list of sites
        """
        test = self.extract_from_list(self.test_sites)
        test = self.concat_test(test)
        y = test[['date', self.metric]].rename(columns={self.metric:'y'})

        if self.control_sites:
            control = self.extract_from_list(self.control_sites)
            X = self.concat_control(control)
            data = y.merge(X, on='date', how='left')
        else:
            data = y
        return data.sort_values(by='date').reset_index(drop=True)


    def get_pre_post(self, data):
        """Get pre-post periods based on the intervention date

        Args:
            data (dataframe): df comming from create_master_df()

        Returns:
            tuple: tuple of lists showing index edges of period before and after intervention
        """
        pre_start = min(data.index)
        pre_end = int(data[data['date'] == self.intervention].index.values)
        post_start = pre_end + 1
        post_end = max(data.index)

        pre_period = [pre_start, pre_end]
        post_period = [post_start, post_end]
        return pre_period, post_period


    def make_report(self, data, pre_period, post_period):
        """Creates the built-in CausalImpact report

        Args:
            data (dataframe): df comming from create_master_df()
            pre_period (list): list coming from get_pre_post()
            post_period (list): list coming from get_pre_post()
        """
        ci = CausalImpact(data.drop(['date'], axis=1), pre_period, post_period)
        print(ci.summary())
        print(ci.summary(output='report'))
        ci.plot()


def authenticate(config='client_secrets.json', token='credentials.json'):
    """Authenticate GSC"""
    if os.path.isfile(token):
        account = searchconsole.authenticate(client_config=config,
                                            credentials=token)
    else:
        account = searchconsole.authenticate(client_config=config,
                                        serialize=token)
    return account


if __name__ == '__main__':
    account = authenticate(config=client_secrets)
    c = Causal(
        account,
        intervention,
        test_sites,
        control_sites=control_sites,
        metric='clicks')
    c.run_causal()
Beware When Using Causal Impact in SEO Experiments
For those using Causal Impact for SEO experiments, results can be really precise, but can also be really wrong. There are many ways that can impact the quality of your predictions:
- Size of the test data.
- Length of the period prior to the experiment.
- Choice of the control group to be compared against.
- Seasonality hyperparameters.
- Number of iterations.
Read my article on Oncrawl on the subject:
Evaluating The Quality Of CausalImpact Predictions
Conclusion
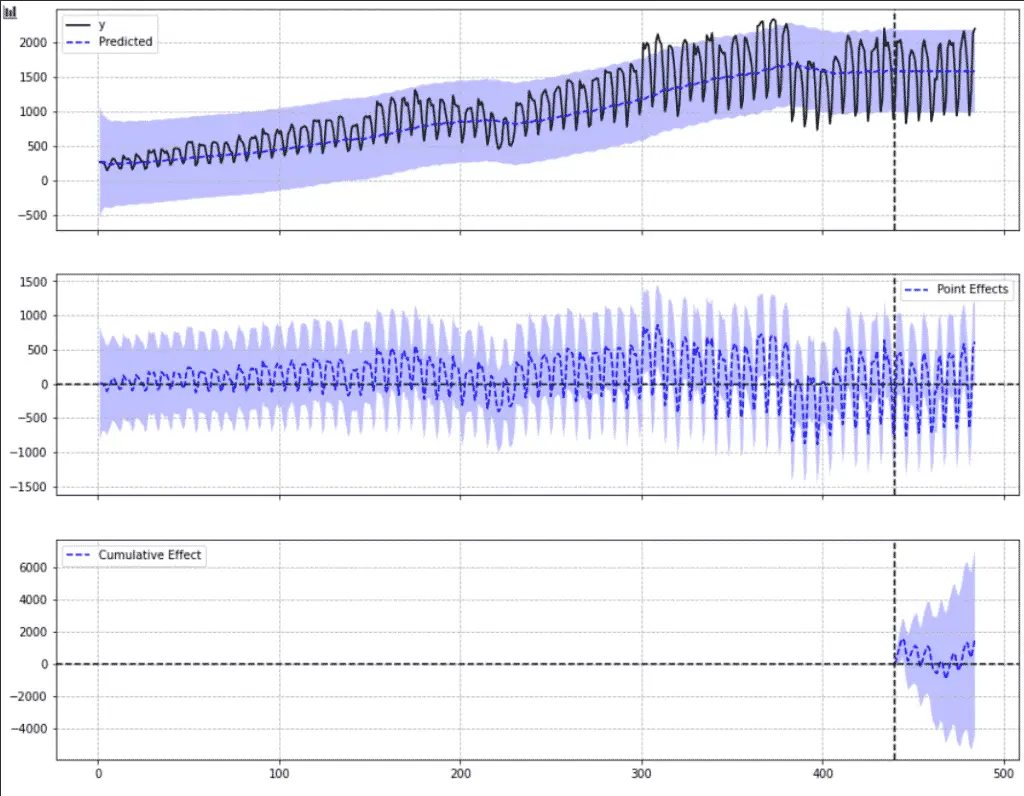
If you are not sure what the graph means, learn how to interpret CausalImpact graphs.
Congratulations, you now have managed to use CausalImpact with Python using the pyCausalImpact package on your Google Search Console data.

SEO Strategist at Tripadvisor, ex- Seek (Melbourne, Australia). Specialized in technical SEO. Writer in Python, Information Retrieval, SEO and machine learning. Guest author at SearchEngineJournal, SearchEngineLand and OnCrawl.