This article is part of the Complete Guide on Google Search Console (GSC)
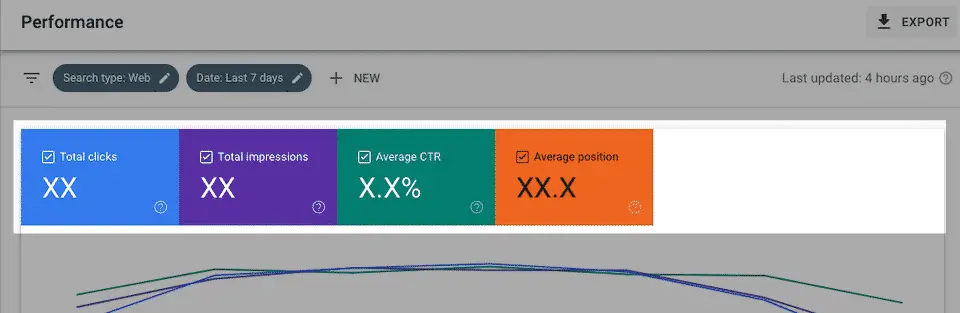
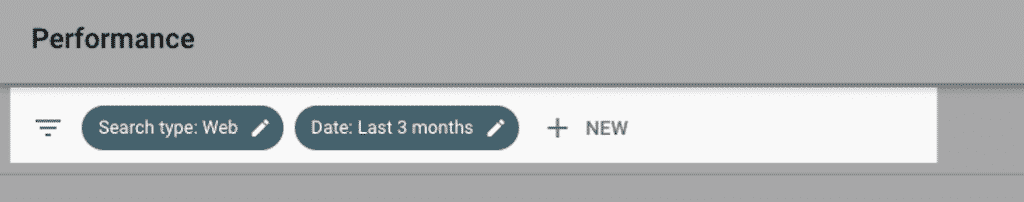
The performance report in Google Search Console provides key metrics on traffic and rankings.
It’s the perfect way to follow up with your ranking health while giving some key metrics to your marketing team.
Search Console Reports
Google Search Console data is made up of dimensions and metrics.
- Metrics are quantitative data where the click metric shows the number of clicks to your site and the impression metric shows the number of times a URL was served in search.
- Dimensions are attributes of your data. For example, the query dimension indicates the query that the user searched on Google and the page shows the URL of the page that was served in Google Search.
Understand Google Search Console Metrics
What are Clicks?
Any clicks that are sending the user to a page outside of Google Search are counted as a click. If the click stays inside search results, it’s not counted.
Going back to search results after clicking and clicking back only counts as one click.
Multiple click behaviours depends on the type of search results.
What are Impressions?
An impression is recorded when it’s appearing in search results for a user. The link sometimes needs to be scrolled into view or visible to be calculated as an impression, but it depends on the type of search element.
A knowledge graph with multiple aggregated data will be grouped into one impression. It’s called “group by property”. However, if you check the report grouped by page, you will see multiple pages that were included in the property.
What is the average CTR?
CTR, or Click-Through Rate, is the impressions to clicks ratio. It is calculated this way:
Impressions / clicks * 100
The average CTR is the percentage of impressions that resulted in a click.
How to interpret the CTR?
The higher your CTR is better because you’re converting people from search results to your website.
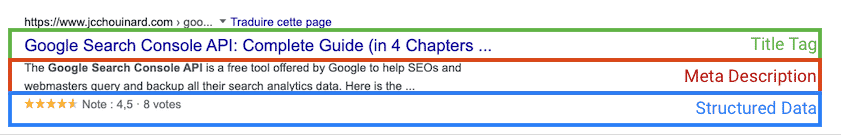
You can influence the average click-through rate (CTR) by:
- Modifying the title tag
- Modifying Meta Description
- Adding structured data to your page
- Building brand recognition
- Updating the favicon on your site
- and more…
What is the Average Position?
The average position metric is where your page is ranked in Google for a given query. Let’s see how it’s reported.
The position is calculated top to bottom, left to right.
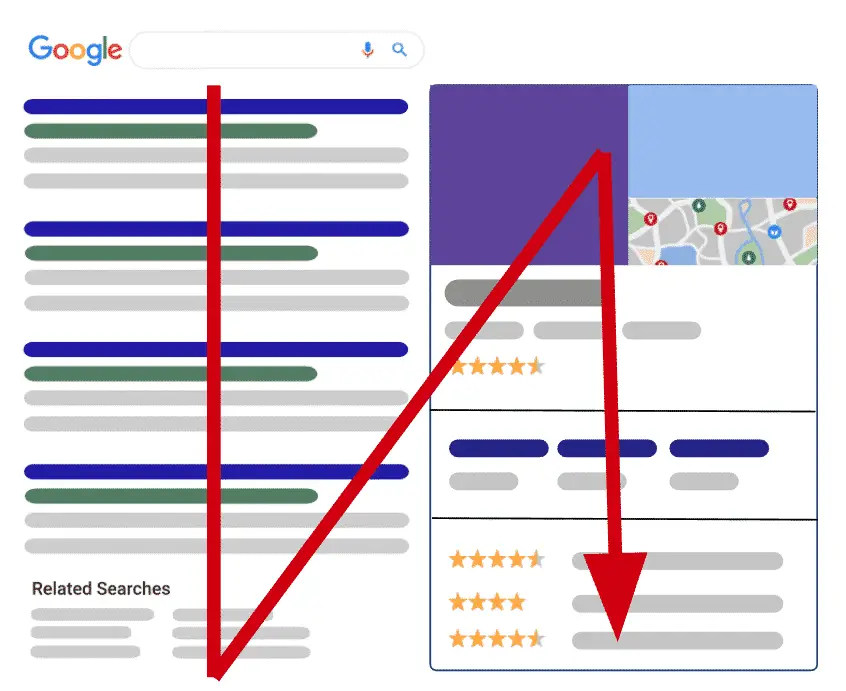
Google search results are made from different categories. snippets, featured snippets, rich snippets, carousels, knowledge graph cards, etc.
Please note that the result needs to have at least one non-query refinement link to be counted as a position.
Here’s a quick example
My company is called Sabre inc and we’re selling cheap printers. If the search query Sabre is making my website rank at positions 1 and 2, the query position will be associated with 1 (always the highest rank you’re ranking for). I’m also trying to rank for the query “cheap printer Pennsylvania” and the higher I’m getting is position 9 (bottom of the first page). My average position is calculated as follows: 1 + 9 /2 = 5.
If your query doesn’t have any impression, it’s not recorded. Every query with impressions is calculated to give you your average position.
Now that you have a good understanding of the performance tab of GSC and you can start playing with it by search type, devices, query, country, pages, is and even benchmark metrics together.
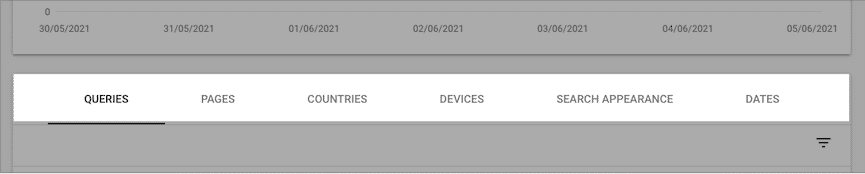
Understand Search Console Dimensions
Dimensions help you define the way that you want to aggregate your data (by query, by page, by country, etc.).
Queries
Queries are the strings searched by users on Google. Only the query strings non-anonymized related to your website are shown.
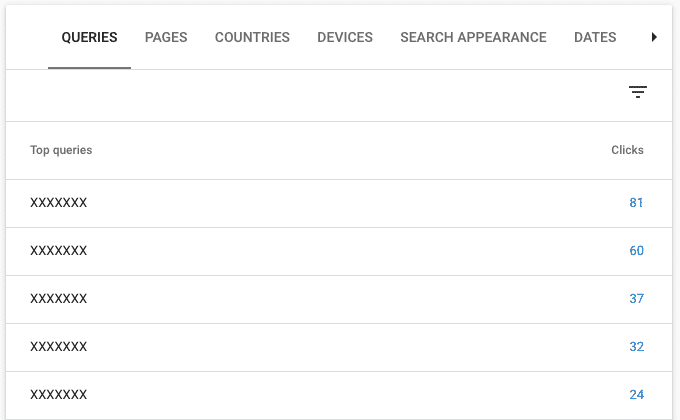
The query report is useful to check the relevancy of queries searched by users and the content that is served from your site to answer that query.
Tip: Use the query report to identify high search volume content opportunities.
Pages
The page dimension report shows pages that are the final URL, also known as the canonical URL, shown in the search results.
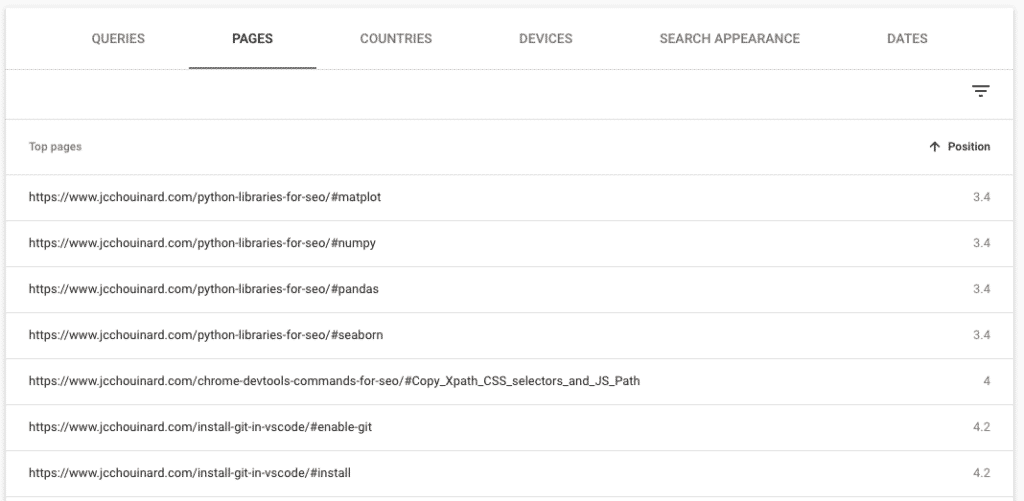
The page report is useful to identify which pages are performing well in search results.
Tip: Make sure that the highest performing pages are linked as closely as possible from your site’s highest authority pages (e.g. the homepage).
Tip 2: Compare the high performing pages with Google Analytics data to identify poor performing user engagement (bounce rate, time on site, etc.). Use A/B testing platforms (e.g. Google Optimize) to make A/B experiments to drive the user engagement up.
Countries
The country where the search came from.
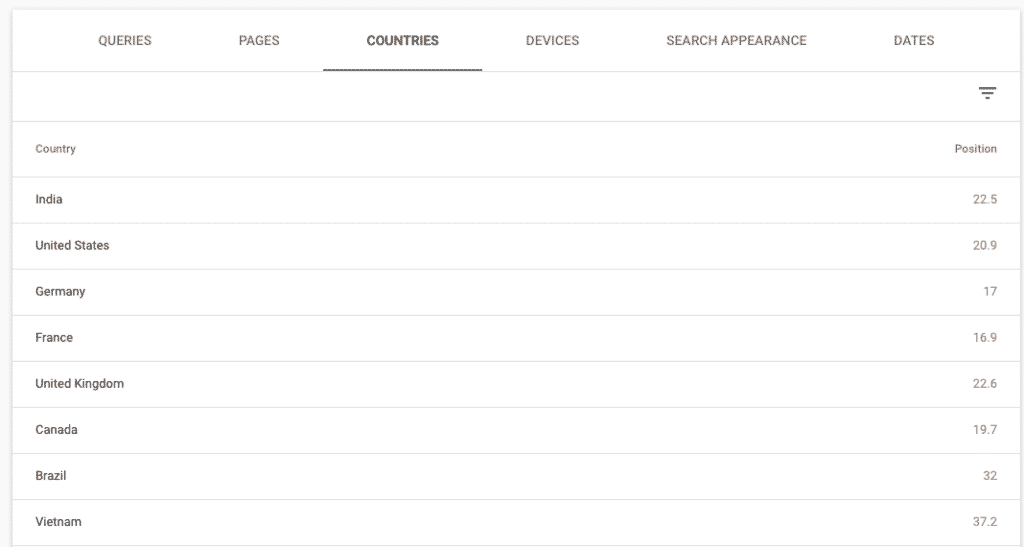
The country report is useful to identify if your international SEO initiatives (e.g. hreflang) are working as desired .
Tip: If you have an international site, check whether or not the right version of your site is ranking for a specific country. Example, au.example.com gets more traffic from the United-States than us.example.com
Devices
This dimension is related to the type of devices where the search is made: desktop, tablet or mobile.
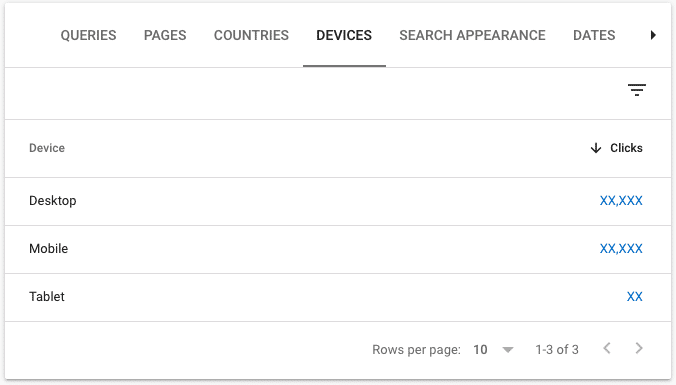
The device report is useful to compare your site’s performance on different devices.
Tip: Identify high-performing pages on desktop that are poorly performing on mobile. Experiment to make the user experience better for those pages on Mobile.
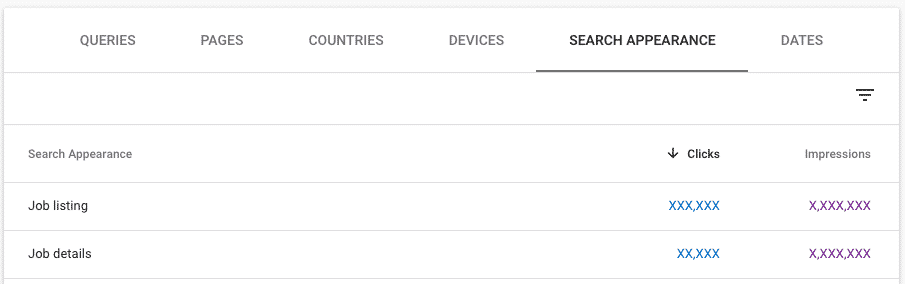
Search Appearance
Google’s Search Engine Result Page is very diversified and not all clicks come from the 10 blue links. The search appearance report lets you see how your site performs within each feature.
For example, you can use the search appearance report to see the clicks that you receive from rich results features like Google For Jobs, Recipies or How-to snippets.
Here is a full list of search appearance types.
Tip: Beware of this report. For example, the Google for Jobs feature inflates the numbers of clicks going to your site, by showing clicks on “job listing” and clicks on “job details” when only clicks on “Job details” actually go to your site.
Make sure that you compare clicks in Google Search Console with Google / organic entrances in Google Analytics to get a sense of the gap between your datasets.
Dates
The dates dimension is useful to build traffic prediction analysis and identify where things might have gone wrong.
Search Console Filters
You can filter the data in Google Search Console by each dimension by checking for match or using Regex.
Filter Using Regular Expressions
Google Search Console uses Re2 syntax. That syntax is quite limited in terms of possibilities.
Still, it provides a good opportunity like selecting pages using patterns.
Match all pages that contains python in the URL.
.*python.*
Match specific pages:
^https:\/\/www\.jcchouinard\.com\/(python-for-seo|google-search-console-api|reddit-api)/$
You can also exclude patterns that matches a certain regular expression.
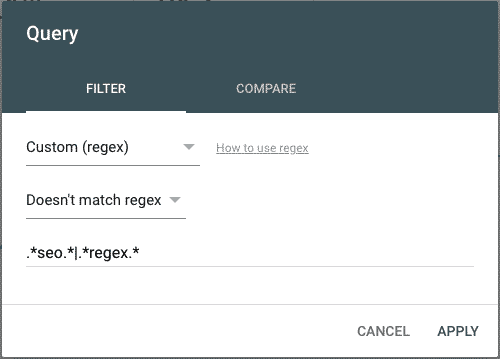
Read this article to find out more about regular expressions in Google Search Console.
Compare Periods with Filters
You can compare different periods with filters together to get a grouping dimension. The comparison is managed by filters. By example, you can group by query and compare between two periods like this week and last week. Here’s how to compare group data:
- Edit an existing filter or click “New” to add a new filter.
- Choose “Compare” in the filter properties box.
- Add the filters/dimensions or periods to compare and click “Apply”.
- You will get a group data comparison, but you can only have one at the time.
How sampled is Google Search Console data?
Search Console has its limitations; you can only see 1000 rows and can only get 16 months of historical data. There’s also the fact that queries and pages data are separated—you need to export both reports separately.
Not only that.
When you refine by query, the data is even more sampled.
In this example, I get 13.4K clicks.

But, when I refine by query (excluding any query matching gibberish), I get only 5.6K clicks shown.

How to get more data from the Performance Report?
To dive deeper into your performance report you can validate subdomains and subdirectories, and use the Google Search Console API.
Validate Subdirectories
Glenn Gabe has written a fantastic guide on How to juice up your Index Coverage reporting by adding directories to Google Search Console (GSC).
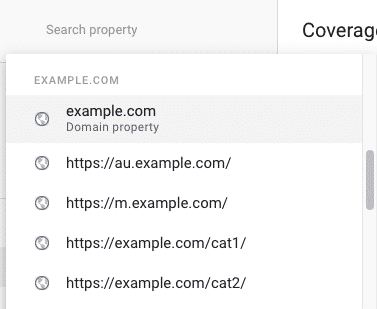
When possible, this is the single most useful technique to gain more insights into your performance report and your indexation issues.
Using The Search Console API
The Google Search Console API lets you backup your performance report but also lets you extract all the rows by date, by page, by query, by country, etc.
There are multiple ways that you can extract data from the GSC API:
- Using Search Analytics for Sheets
- Using Analytics Edge with Excel
- Using Python to extract all your search console data
- Using R to use the Search Console API
Other Articles in the Series on Google Search Console
- How to validate your site in GSC
- How to use the Performance Report in Google Search Console
- How to use the index coverage report
- How to use the URL Inspection Tool
- How to use the Crawl Stats Report
- How to use (and not use) URL Removal tool in GSC (Coming soon…)
- How to use URL Parameters Tools Without Killing Your Site (Coming soon…)
- Google Search Console Use Cases (Coming soon…)
- Regular Expressions (RegEx) in Google Search Console
Tl;dr;
In a nutshell, the Google Search Console Performance report gives you a ton of insights into your SEO performance on search, but it is heavily sampled. You can leverage the API and validate all subdirectories to gain more insight.

Tech marketer, SEO, and remote work advocate, Gab is the CMO at V2 Cloud. Living in Quebec City, he’s a big fan of hiking, traveling, gins, and telling bad jokes.