As part of the series of tutorials on Python PCA, we will learn what the explained variance is and what it means in Principal Component Analysis.
What is the Explained Variance in Principal Component Analysis?
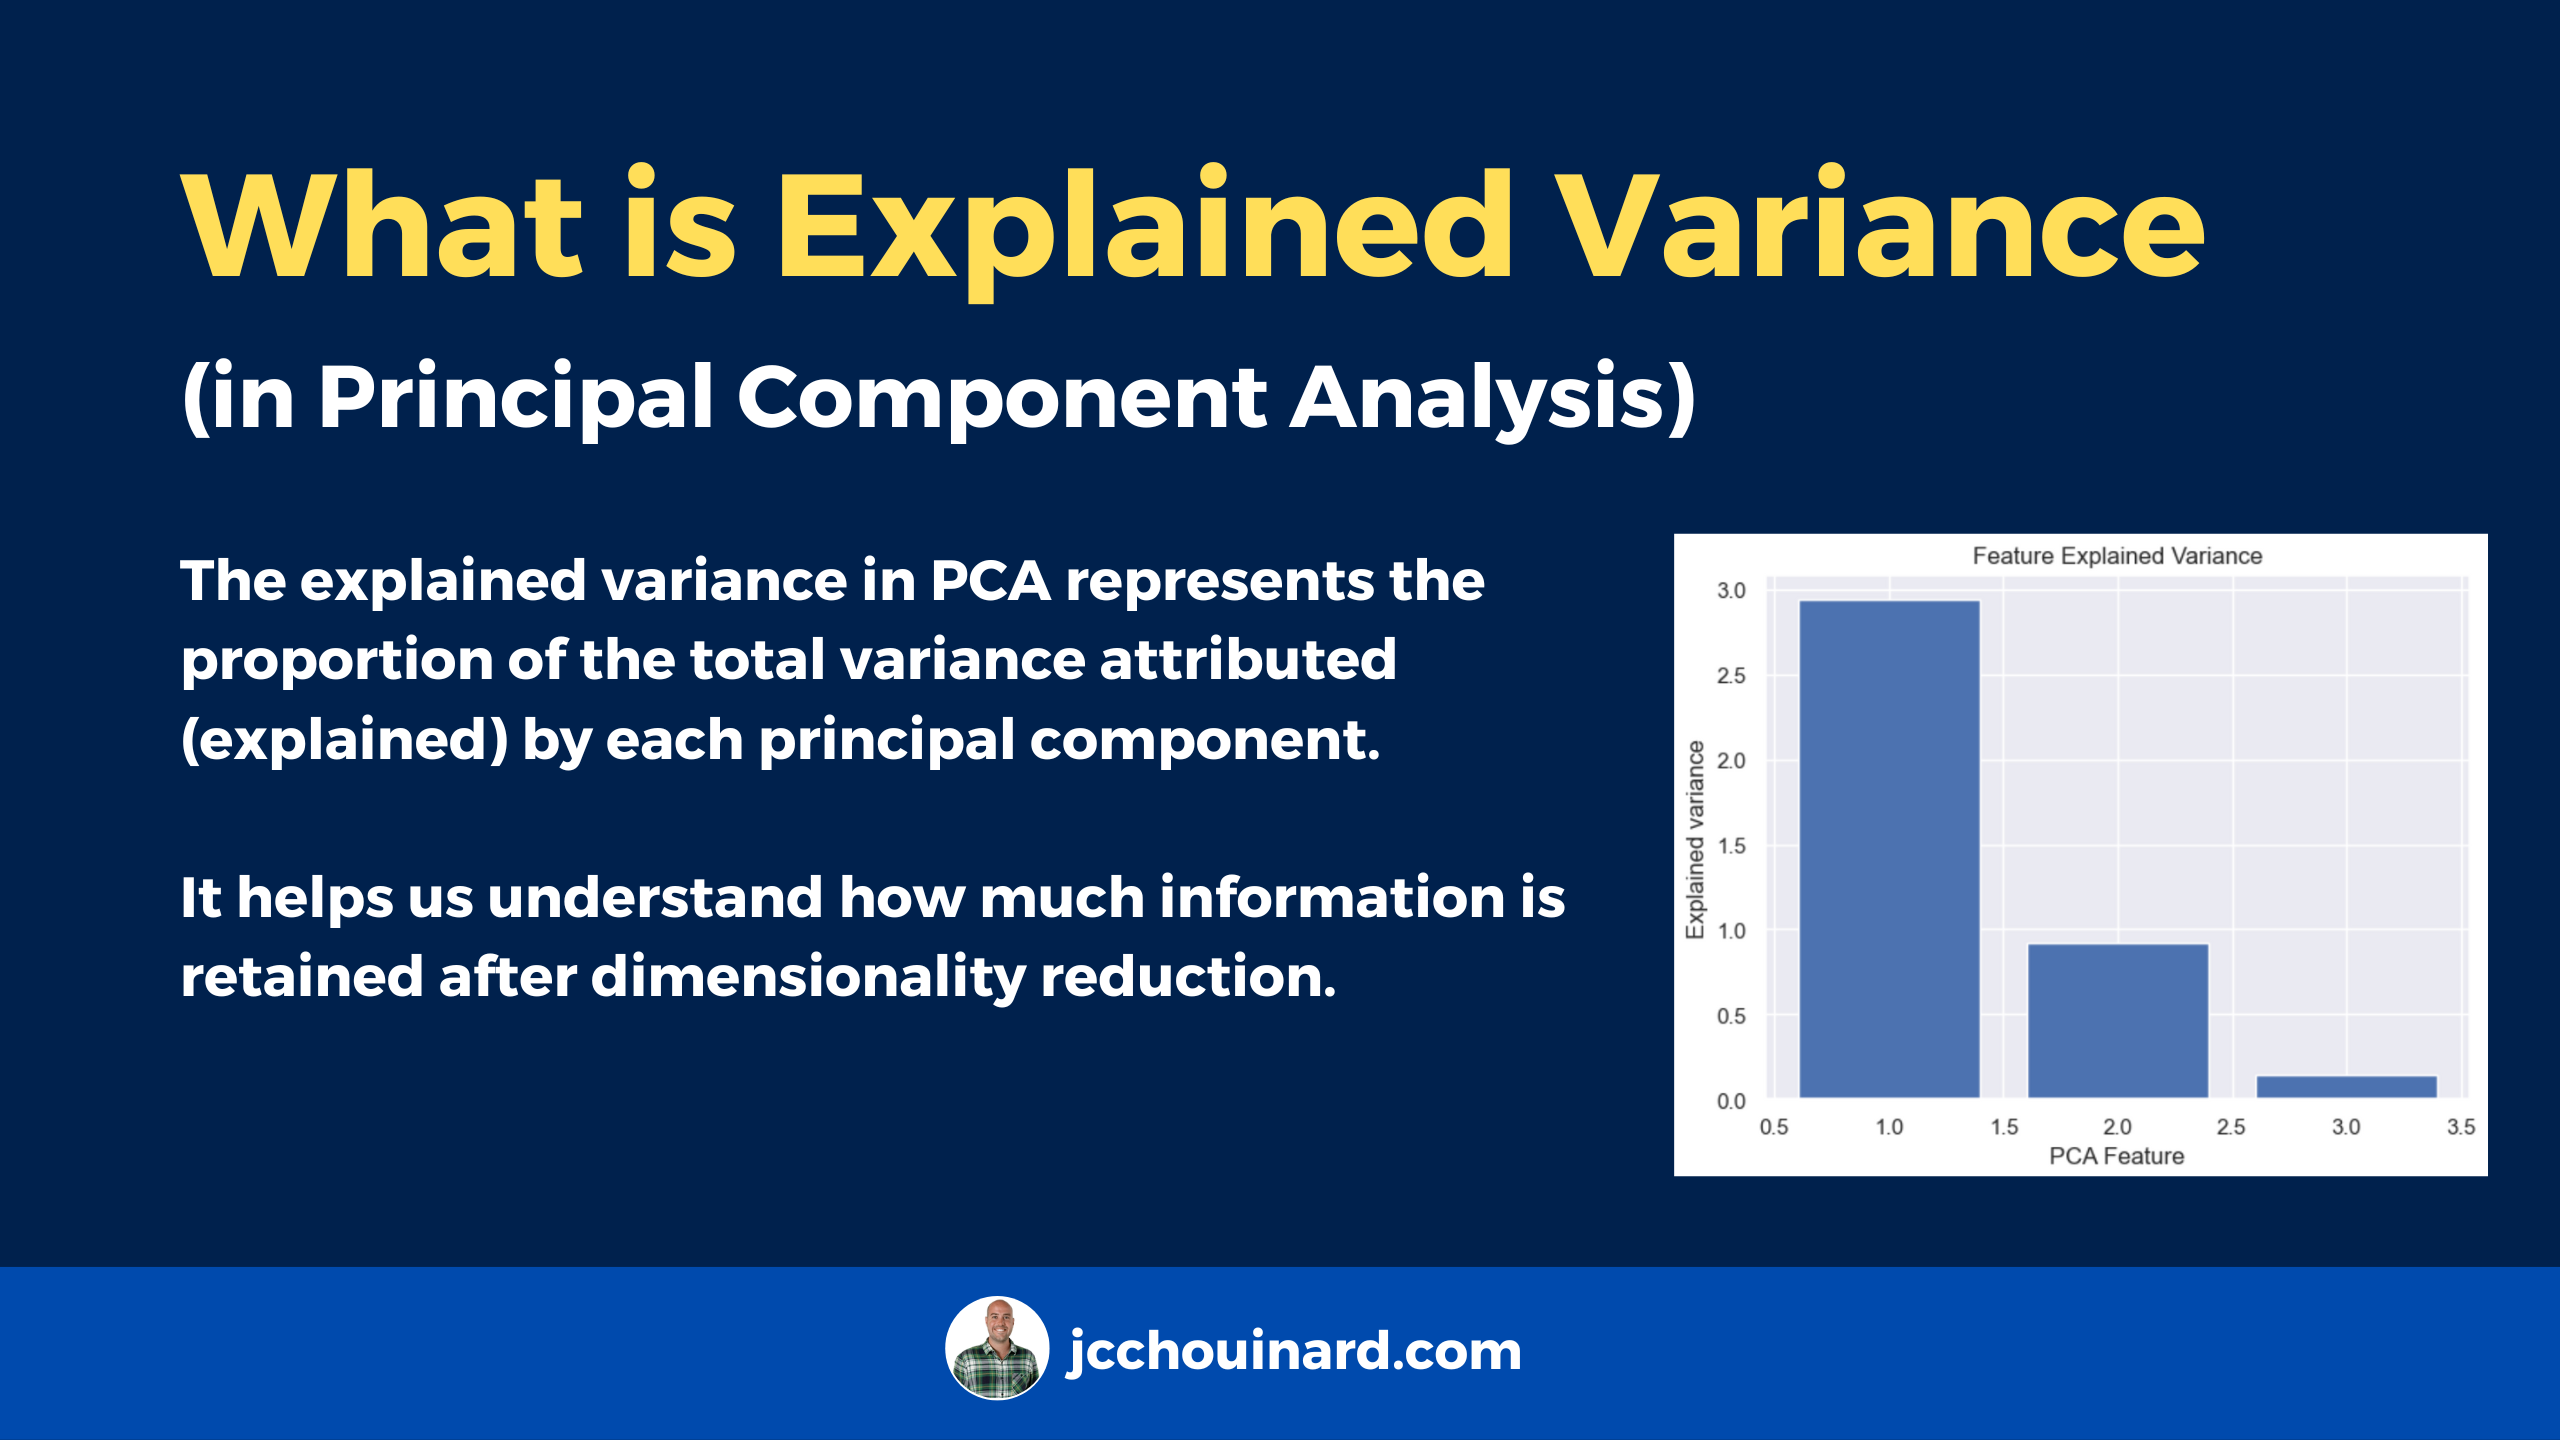
The explained variance in Principal Component Analysis (PCA) represents the proportion of the total variance attributed (explained) by each principal component.
It helps us understand how much information is retained after dimensionality reduction. It is the portion of the original data’s variability that is captured by each principal component.
The larger the eigenvalue, the more important the corresponding eigenvector is in explaining the variance of the data.
Specifically, it is an array of values where each value equals the variance of each principal component and the length of the array is equal to the number of components defined with n_components.
Explained Variance in Python
In PCA, the explained variance is accessed using the explained_variance_ attribute of the pca object.
pca.explained_variance_In this Python example, we load the iris dataset, scale its features and apply PCA to reduce the original dataset to two dimensions. Then, we train and transform the object and finally show the explained variance.
import numpy as np
import pandas as pd
import matplotlib.pyplot as plt
from sklearn.decomposition import PCA
from sklearn.datasets import load_iris
from sklearn.preprocessing import StandardScaler

# Load Iris dataset
iris = load_iris()
X = iris.data
y = iris.target

# Standardize the data
scaler = StandardScaler()
X_standardized = scaler.fit_transform(X)

# Apply PCA with two components
pca = PCA(n_components=2)
X_pca = pca.fit_transform(X_standardized)

explained_variance = pca.explained_variance_
explained_variance
The result is an explained variance, expressed as an array with two values.
array([2.93808505, 0.9201649 ])Interpret the Explained Variance in PCA
The explained variance array is composed of absolute values. The greater the value, the more it contributes to the variance of the Principal Components. In the above, the PC1 contributes to 2.93 units of variance in the original dataset. The PC2, contributes to 0.92 units.
To make it more useful, we generally use the explained variance ratio, that gives the ratio of each explained variance to the cumulative explained variance.
cumulative explained variance = 2.93808505 + 0.9201649Here the explained variance ratio is accessed using the pca.explained_variance_ratio_ attribute.
pca.explained_variance_ratio_
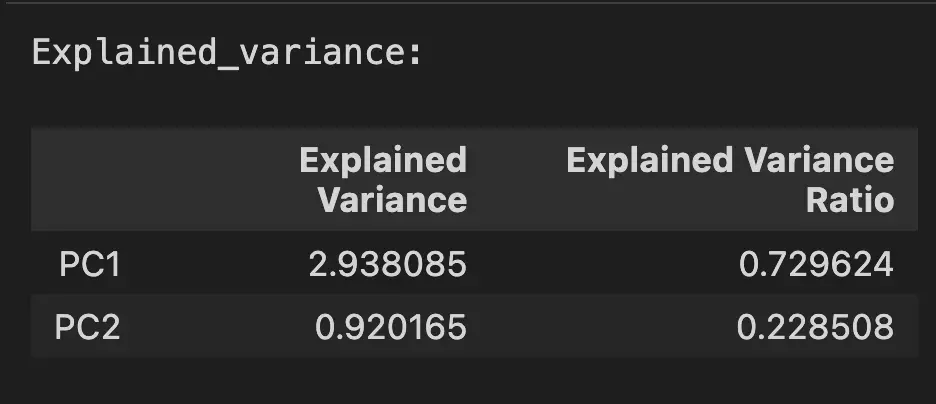
array([0.72962445, 0.22850762])Now, we can see that the PC1 contributes to 73% of the variance, and PC2 to 23% of the variance, which sums up to 96% of the variance in the data is explained by these two Principal Components. The remaining 4% is what was “discarded” when reducing dimensions.
pd.DataFrame({
    'Explained Variance': pca.explained_variance_,
    'Explained Variance Ratio': pca.explained_variance_ratio_,
}, index=['PC1', 'PC2'])
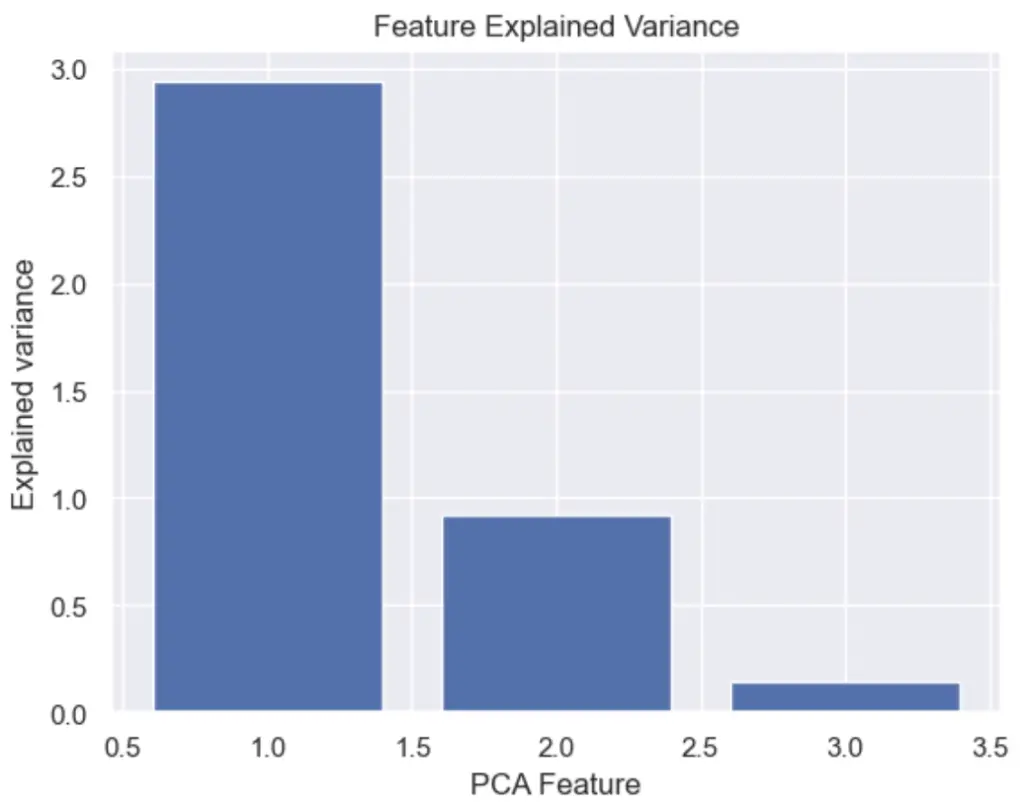
How to Plot the Feature Explained Variance in Python?
We can plot the PCA explained variance to see the variance of each principal component feature.
import pandas as pd
from sklearn import datasets
from sklearn.preprocessing import StandardScaler
from sklearn.decomposition import PCA
import matplotlib.pyplot as plt
import seaborn as sns
sns.set()

# load features and targets separately
iris = datasets.load_iris()
X = iris.data
y = iris.target

# Data Scaling
x_scaled = StandardScaler().fit_transform(X)

# Reduce from 4 to 3 features with PCA
pca = PCA(n_components=3)

# Fit and transform data
pca_features = pca.fit_transform(x_scaled)

# Bar plot of explained_variance
plt.bar(
    range(1,len(pca.explained_variance_)+1),
    pca.explained_variance_
    )


plt.xlabel('PCA Feature')
plt.ylabel('Explained variance')
plt.title('Feature Explained Variance')
plt.show()
What is the Difference Between the Explained Variance and the Eigenvalue?
The eigenvalue and the explained variance in Principal Component Analysis (PCA) are related concepts and often used as synonyms, they are not exactly the same.
Eigenvalues indicate the variance along each principal component. Explained variance is the proportion of total dataset variance captured by each principal component.
| Eigenvalues | Explained Variance |
|---|---|
| Variance along each component | Proportion of total dataset variance |
| Larger eigenvalues capture more variance | Expressed as a percentage |
What is a Eigenvector in PCA
The eigenvector in PCA is a unit vector of the transformation matrix of the length equal to 1 that represents the direction of the principal component.
What is an Eigenvalue in PCA
The eigenvalue is the coefficient applied to the eigenvector showing the variance that can be attributed to each of the principal components and giving the eigenvectors their length. The larger the eigenvalue, the more important the corresponding eigenvector in explaining the variance of the data.
An eigenvalue is an array of values where each value that equals the variance of each principal component.

SEO Strategist at Tripadvisor, ex- Seek (Melbourne, Australia). Specialized in technical SEO. Writer in Python, Information Retrieval, SEO and machine learning. Guest author at SearchEngineJournal, SearchEngineLand and OnCrawl.