This article is part of the Complete Guide on Google Search Console (GSC)
The crawl stats report shows your statistics about Google crawling history of your website.
Having an understanding of the crawling of pages on your website is vital for any SEO.
Crawl Stats Report: An Alternative to Server Logs
Server logs can be unavailable to you, can be expensive to query, or even be incomplete.
In this, the crawl stats report is a good alternative to server logs.
It gives quick access to data on the requests made to your server. It also reports on requests that have not reached your server, thus wouldn’t be reported in your server logs.
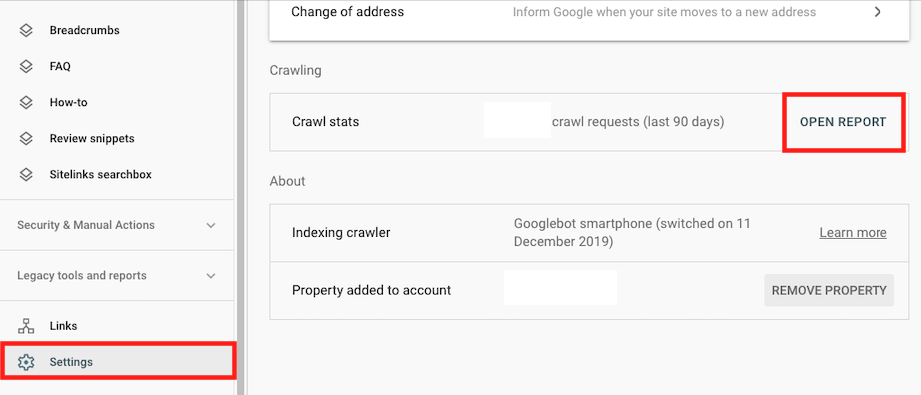
Open the Crawl Stats Report
Go into the Setting tab and open Crawl Stats Report.
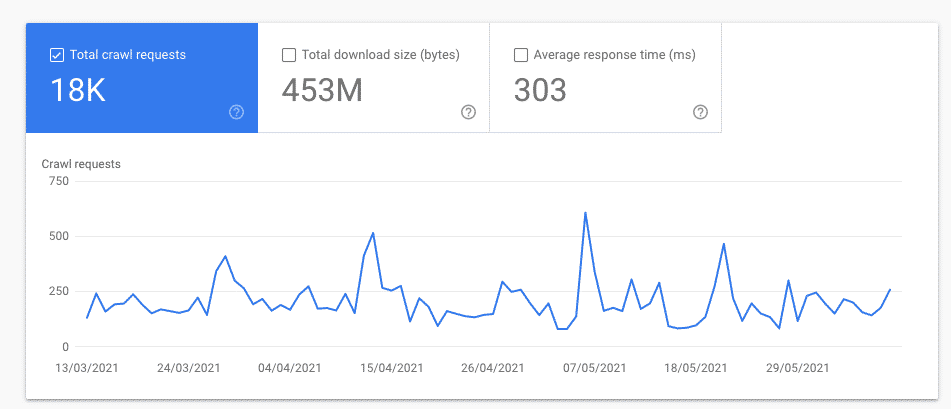
Total crawl requests
The total amount of crawl requests that your domain (or URL prefixes) got over the last 90 days. It’s a great way to analyze if the amount of crawl requests is well correlated with the number of pages you want crawled.
Total download size
A crawl by search engine bot is checking everything available on your website, and that’s including all files and & resources. Those resources are calculated in Bytes and include files HTML, associated image bytes, scripts files, and CSS files.
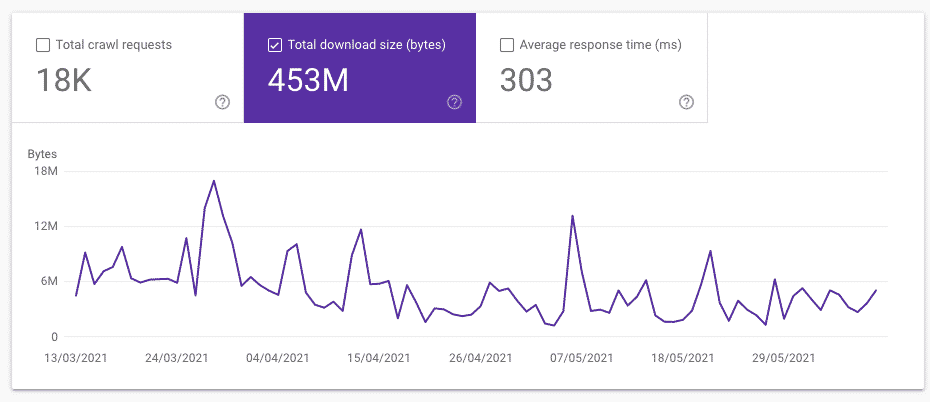
There are some hints that Total download size is more representative to crawl budget than total crawl requests.
For example, Google can crawl much more 404 pages than pages returning 200 status code. The reason is that Google only need to fetch the status code on the former, and need to render the page on the latter.
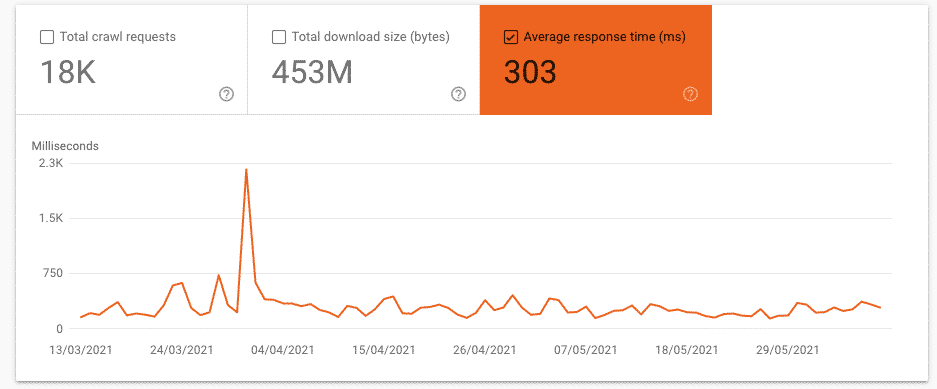
Average response time
The average response time is associated with the time that it’s taking for a robot to gather the page resources. It’s also known as page rendering time.
Hosts (on domain property)
This section is only available in the domain property and is showing you specifically the trends on how your URL prefixes are crawled and if there are any issues.
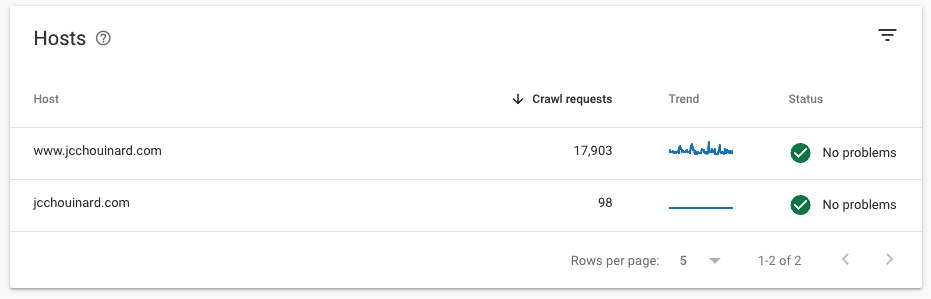
You can access a crawl report specific to those prefixes and report problems such as robots.txt fetching, DNS resolution, and server connectivity.
There’s more information about those types of issues available if you need it.
Crawl request breakdown
The crawl request breakdown is giving you a global view of your crawl data over 90 days. Here are the categories that are part of this section:
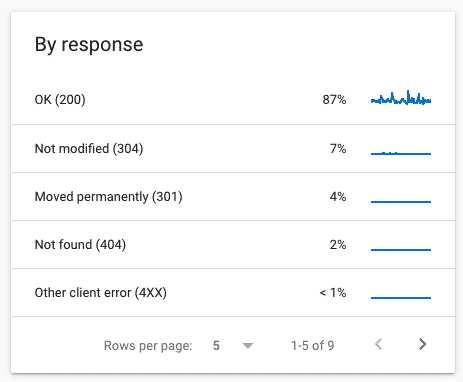
by response:
This report is divided into HTTP response status codes. You can dig deeper in 200 (accessible), 301(moved permanently), 304(not modified), 302(moved temporarily), 404 (not found), etc.
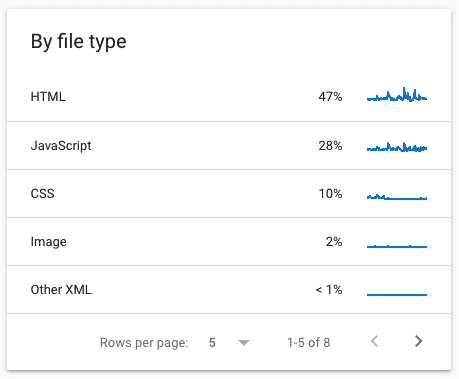
by file type:
Similar to the by response report, but separated by the type of resources on your website; HTML, Javascript, CSS, Images, JSON, etc.
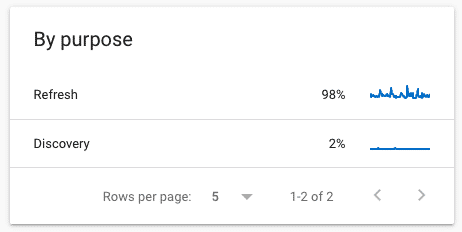
by purposes:
It’s either “refreshed” or “discovery”—you have pages that are being recrawled again by Googlebot or you have new pages/resources that were discovered. If you’re seeing pages that are not supposed to be indexed, you can easily identify them and solve crawl issues.
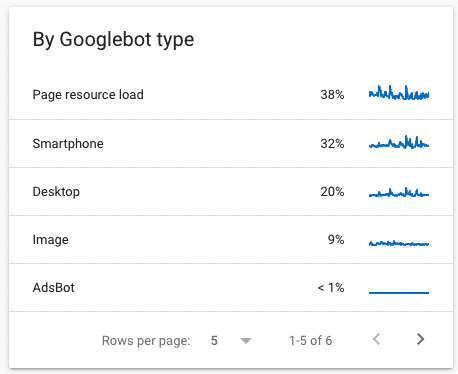
by Googlebot type:
This is the type of Google bot that is crawling your website. Smartphone, page resources load, desktop, etc. It’s accessible to understand the way your website is crawled by knowing the type of bots that are crawling it.
Other Articles in the Series on Google Search Console
- How to validate your site in GSC
- How to use the Performance Report in Google Search Console
- How to use the index coverage report
- How to use the URL Inspection Tool
- How to use the Crawl Stats Report
- How to use (and not use) URL Removal tool in GSC (Coming soon…)
- How to use URL Parameters Tools Without Killing Your Site (Coming soon…)
- Google Search Console Use Cases (Coming soon…)
- Regular Expressions (RegEx) in Google Search Console
Conclusion
At last, using the crawl stats report in Google Search Console doesn’t have any more secrets for you.

Tech marketer, SEO, and remote work advocate, Gab is the CMO at V2 Cloud. Living in Quebec City, he’s a big fan of hiking, traveling, gins, and telling bad jokes.