Outliers can have a big impact on the measures of variability and should be understood, and dealt with accordingly, by statistician and data scientists. In this tutorial, we will use summary statistics and Python to calculate outliers in a dataset.
What are Outliers in Statistics
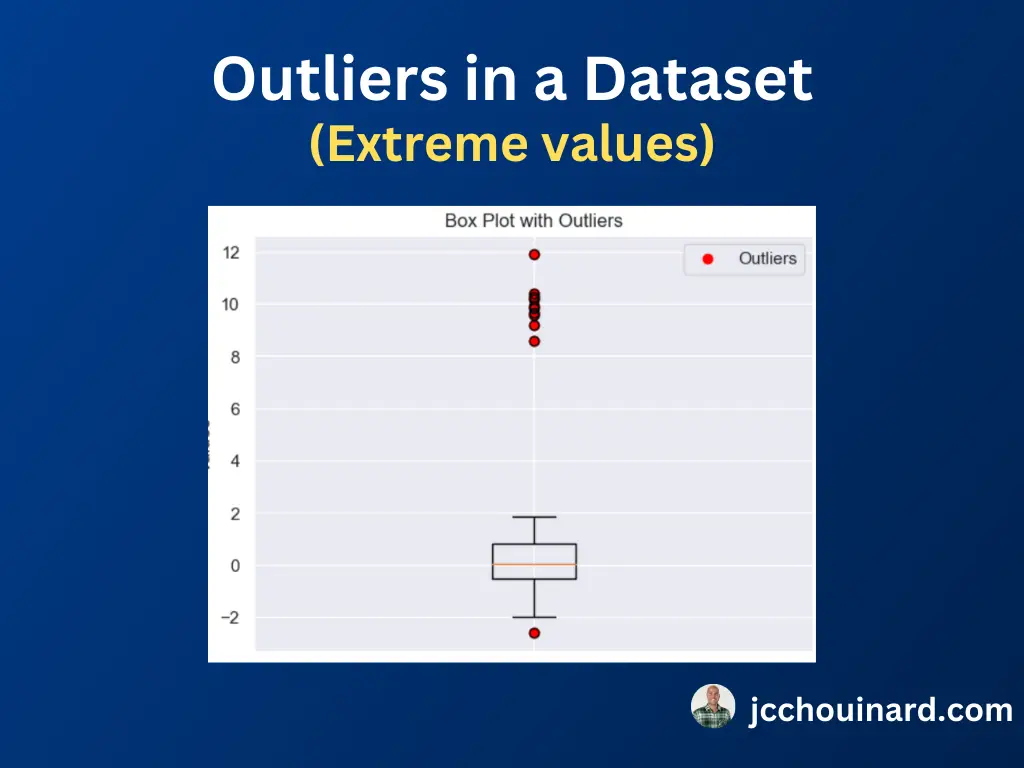
Outliers in statistics represent the extreme data points that are significantly different from the others.
Outliers are defined by one of these rules:
- data point < Q1 – (1.5 * IQR)
- data point > Q3 + (1.5 * IQR)
Simply put, outliers are data points in data set that are outside of the box plot limits shown in the graph above.
How to Find Outliers in a Dataset with Python
There are two main approaches to identify outliers in a Dataset with Python:
- Using standard deviation
- Using quantiles
How to Find Outliers using a Quantile-Based Approach
The quantile-based approach to finding or removing outliers in a dataset consists of removing a percentage of the smallest and largest values in the data.
We find the outliers by computing the quartiles and find the first and the last quantiles. Then, we compute the interquartile ranges on the dataset. We then verify if the data point is greater than or smaller than 1.5 * IQR.
So, if we take our custom dataset:
import numpy as np

# Generate a random dataset with outliers
data = np.concatenate(
        [
            np.random.normal(0, 1, 100),
            np.random.normal(10, 1, 10)
        ]
    )
We can calculate the quartiles and the iqr using either the np.percentile, or the np.quantile functions, or alternatively, use the scipy.stats.iqr function.
# Calculate quartiles and IQR for outlier detection
q1 = np.percentile(data, 25)
q3 = np.percentile(data, 75)
iqr = q3 - q1 # equivalent to scipy.stats.iqr(data)

# Define the lower and upper bounds for outliers
lower_bound = q1 - 1.5 * iqr
upper_bound = q3 + 1.5 * iqr

# Identify outliers
outliers = [x for x in data if x < lower_bound or x > upper_bound]
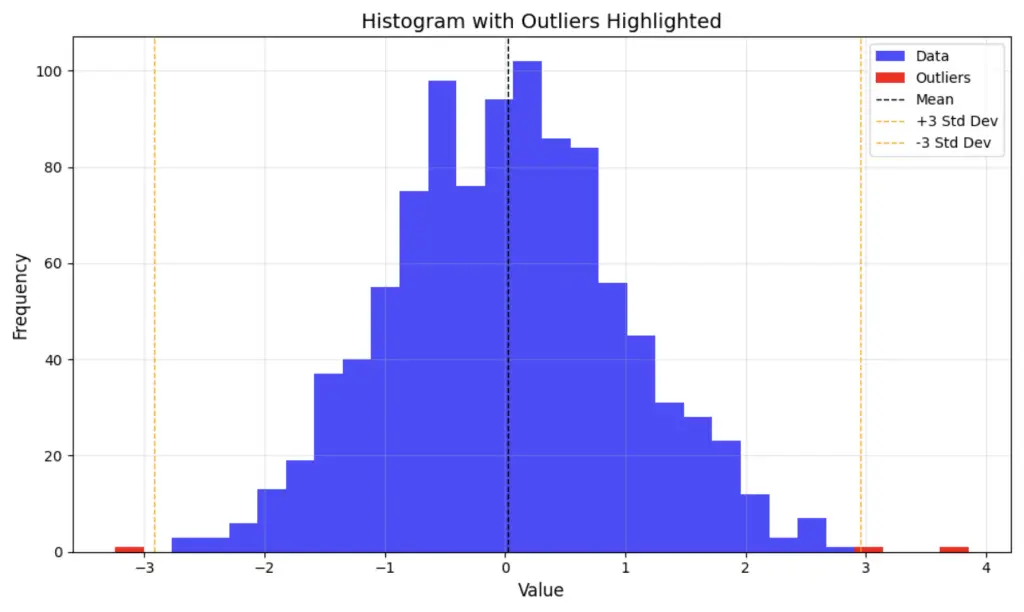
How to Find Outliers using a Standard Deviation Approach
To find outliers in a dataset using the standard deviation, calculate the mean and the standard deviation. Outliers will be represented by any point that is 3 standard deviations away from the mean.
# Removing Outliers with Standard Deviation
mean = df['column'].mean()
std = df['column'].std()

threshold = 3 * std

lower_bound = mean - threshold
upper_bound = mean + threshold

filtered_df = df[(df['column'] > lower_bound) & (df['column'] < upper_bound)]

SEO Strategist at Tripadvisor, ex- Seek (Melbourne, Australia). Specialized in technical SEO. Writer in Python, Information Retrieval, SEO and machine learning. Guest author at SearchEngineJournal, SearchEngineLand and OnCrawl.