This post is part of the complete Guide on Python for SEO
This is the best place to learn how to set up Google Analytics Reporting API v4 via Python.
(simple step-by-step guide)
If you are looking to use the API with GA4, we have updated this tutorial to work with the new API that you can find by reading: Google Analytics Data API using Python.
Of course, you will need some basics in Python to fully understand, but I will guide you through each step carefully.
In case you feel like you lack what you need to complete this guide I made a complete series to help you learn Python for SEO.
To make an API call to Google Analytics Reporting API using Python, follow these steps.
- Setup Python
- Create a New Project and Service Account
- Install Google API Client in Python
- Connect Python to Google Analytics Reporting API
- Make the API Call
- Parse The Report Data
- Create a DataFrame With Your Data
1. Setup Python
I will not go extensively in how to get set up with Python, since I already made a few guides on the subject.
Make sure that you have followed those preliminary steps before you get started using Google Analytics Reporting API.
- Install Python
- Learn Basics in Python (extensive guide)
- Run Python With Spyder IDE
2. Create a New Project and Service Account
It is now time to create a new project to help you use the Google Analytics Reporting API.
What you will need is to create a “service account key” in Google Developers Console and download the JSON Key File.
I will not show you extensively how to get your JSON credentials file here, but I understand that this part can get confusing.
This is why I have made a simple beginner guide to help you get connected to Google Analytics API in Google developer console.
Otherwise here are the simple steps:
- Sign-in to Google’s developers console
- Create a Project in Google API
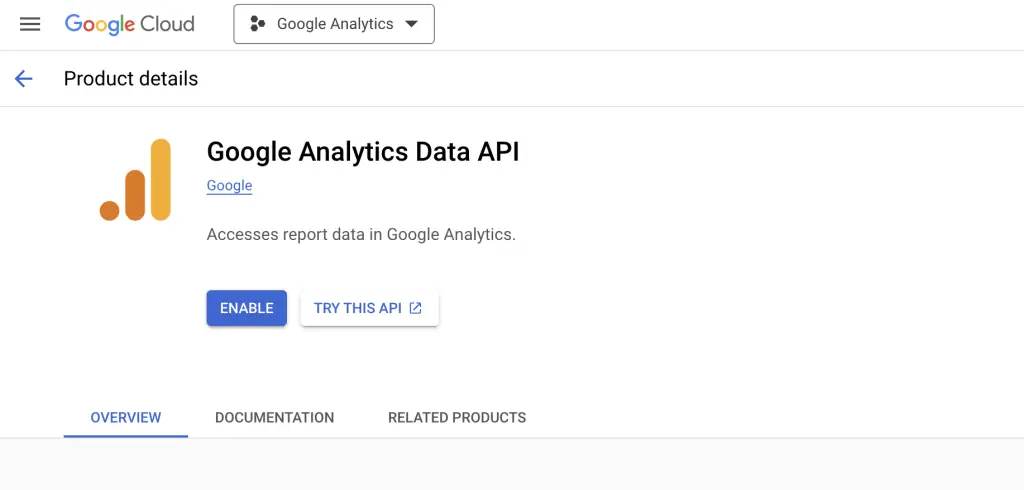
- Activate the Google Analytics Reporting API
- On the credentials, page click create credentials and select Service account key.
- Create a JSON key and download it to your computer.
- Log in to Google Analytics
- In the Admin, select the view that you want to extract data from and go to User Management.
- Open the service account JSON key file that you just downloaded in a text editor.
- Copy the client_email and give this email read permissions.
3. Install Google API Client in Python
Go to Anaconda Prompt, then add this command
conda install -c conda-forge google-api-python-client
If you are using Pip, just go to your command line and add this command.
pip install --upgrade google-api-python-client
4. Connect Python to Google Analytics Reporting API
Now it is time to connect Python to the Google Analytics API using Spyder IDE.
To connect to this API, follow those steps.
- Create a Project in Spyder IDE
- Rename your JSON key to
client_secrets.json - Save the JSON file to your working directory
- Load this bit of code.
#Load Libraries
from oauth2client.service_account import ServiceAccountCredentials
from googleapiclient.discovery import build
import httplib2

#Create service credentials
#Rename your JSON key to client_secrets.json and save it to your working folder
credentials = ServiceAccountCredentials.from_json_keyfile_name('client_secrets.json', ['https://www.googleapis.com/auth/analytics.readonly'])

#Create a service object
http = credentials.authorize(httplib2.Http())
service = build('analytics', 'v4', http=http, discoveryServiceUrl=('https://analyticsreporting.googleapis.com/$discovery/rest'))
5. Make Your First API Call
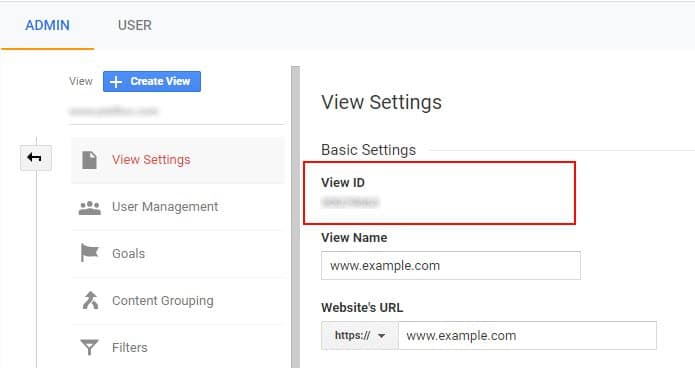
To make your first API call you will need to get your view ID from Google Analytics. (remember to use the same view that you authorized your service account).
Go to Google Analytics > Admin > View > View Settings and copy the View ID.
Once you have your view ID, you are ready to make your first API call.
There are many queries you can make with the batchGet reports. Just play around with Google reporting API tester.
In my case, I needed to create a report of the 100 top pages by sessions for the last 30 days. I also needed it sorted and filtered by pagePath containing “product” in the URL, but also exclude the pages generated by google translate.
For advanced filtering, see Google’s documentation.
    body={
        'reportRequests': [
            {
                'viewId': 'XXXXXXXX', #Add View ID from GA
                'dateRanges': [{'startDate': '30daysAgo', 'endDate': 'today'}],
                'metrics': [{'expression': 'ga:sessions'}],
                'dimensions': [{"name": "ga:pagePath"}], #Get Pages
                "filtersExpression":"ga:pagePath=~products;ga:pagePath!@/translate", #Filter by condition "containing products"
                'orderBys': [{"fieldName": "ga:sessions", "sortOrder": "DESCENDING"}],
                'pageSize': 100
            }]
    }
).execute()
We now have made our first call.
Quick Tip!
You could also use template literals (like you would do in JavaScript) to add dynamic filters.
To do this, use the f and the curly brackets {} like this f"ga:pagePath={regex}".
regex='~^/see-company/.*'

response = service.reports().batchGet(
    body={
        'reportRequests': [
            {
                'viewId': '30029063',
                'dateRanges': [{'startDate': '90daysAgo', 'endDate': 'today'}],
                'metrics': [{'expression': 'ga:sessions'}],
                'dimensions': [{"name": "ga:pagePath"}],
                "filtersExpression":f"ga:pagePath={regex}",
                'orderBys': [{"fieldName": "ga:sessions", "sortOrder": "DESCENDING"}],
                'pageSize': 10000
            }]
    }
).execute()
As you can see, you don’t have any useable reports yet. This is because you need to parse your report data.
6. Parsing The Report Data
We will now extract data in order to use it.
First, we create 2 empty lists to store data. Then, we will read the response and extract the data that we want.
#create two empty lists that will hold our dimentions and sessions data
dim = []
val = []

#Extract Data
for report in response.get('reports', []):

    columnHeader = report.get('columnHeader', {})
    dimensionHeaders = columnHeader.get('dimensions', [])
    metricHeaders = columnHeader.get('metricHeader', {}).get('metricHeaderEntries', [])
    rows = report.get('data', {}).get('rows', [])

    for row in rows:

        dimensions = row.get('dimensions', [])
        dateRangeValues = row.get('metrics', [])

        for header, dimension in zip(dimensionHeaders, dimensions):
            dim.append(dimension)

        for i, values in enumerate(dateRangeValues):
            for metricHeader, value in zip(metricHeaders, values.get('values')):
                val.append(int(value))
7. Create a DataFrame With Your Data
We will now create a Pandas Dataframe.
df = pd.DataFrame()
df["Sessions"]=val
df["pagePath"]=dim
df=df[["pagePath","Sessions"]]
7. Export to CSV
Having a dataframe you can do pretty much whatever you want with your data.
Just to make sure that you are good to go, let’s export the file to CSV.
df.to_csv("page_by_session.csv")
Full Reusable Code
#Load Libraries
from oauth2client.service_account import ServiceAccountCredentials
from apiclient.discovery import build
import httplib2
import pandas as pd

#Create service credentials
#Rename your JSON key to client_secrets.json and save it to your working folder
credentials = ServiceAccountCredentials.from_json_keyfile_name('client_secrets.json', ['https://www.googleapis.com/auth/analytics.readonly'])

#Create a service object
http = credentials.authorize(httplib2.Http())
service = build('analytics', 'v4', http=http, discoveryServiceUrl=('https://analyticsreporting.googleapis.com/$discovery/rest'))
response = service.reports().batchGet(
    body={
        'reportRequests': [
            {
                'viewId': 'XXXXXXXX', #Add View ID from GA
                'dateRanges': [{'startDate': '30daysAgo', 'endDate': 'today'}],
                'metrics': [{'expression': 'ga:sessions'}],
                'dimensions': [{"name": "ga:pagePath"}], #Get Pages
                "filtersExpression":"ga:pagePath=~products;ga:pagePath!@/translate", #Filter by condition "containing products"
                'orderBys': [{"fieldName": "ga:sessions", "sortOrder": "DESCENDING"}],
                'pageSize': 100
            }]
    }
).execute()

#create two empty lists that will hold our dimentions and sessions data
dim = []
val = []

#Extract Data
for report in response.get('reports', []):

    columnHeader = report.get('columnHeader', {})
    dimensionHeaders = columnHeader.get('dimensions', [])
    metricHeaders = columnHeader.get('metricHeader', {}).get('metricHeaderEntries', [])
    rows = report.get('data', {}).get('rows', [])

    for row in rows:

        dimensions = row.get('dimensions', [])
        dateRangeValues = row.get('metrics', [])

        for header, dimension in zip(dimensionHeaders, dimensions):
            dim.append(dimension)

        for i, values in enumerate(dateRangeValues):
            for metricHeader, value in zip(metricHeaders, values.get('values')):
                val.append(int(value))

#Sort Data
val.reverse()
dim.reverse()

df = pd.DataFrame()
df["Sessions"]=val
df["pagePath"]=dim
df=df[["pagePath","Sessions"]]
df

#Export to CSV
df.to_csv("page_by_session.csv")
Conclusion
This is the end of the tutorial.
If you would like to create advanced visualizations from your data, I would suggest that you read Nicolas Lierman‘s post that inspired this post and that will show you to create matplotlib’s vizualisations from your Google Analytics Data.
To replicate something like this using Jupyter, follow this guide by Woratana Perth.
I’d love to see more extractions that you were able to make using Google Analytics Reporting API with Python. Let me know in the comments.

SEO Strategist at Tripadvisor, ex- Seek (Melbourne, Australia). Specialized in technical SEO. Writer in Python, Information Retrieval, SEO and machine learning. Guest author at SearchEngineJournal, SearchEngineLand and OnCrawl.