This tutorial is a simple introduction to Pandas Python library.
You will learn the basics of Pandas in Python and how pandas can replace Excel, along with examples of Excel functions translated into Pandas functions.
Can Python Replace Excel?
You can replace Excel with Python, by using the Pandas library which allows you to deal with DataFrames in a similar, but more powerful, way as what you would do with Excel tables.
What is Pandas in Python?
Pandas is one of the most common Python libraries used in data science, data analysis and SEO. It is an open-source package built on top of NumPy which allow the manipulation of multi-dimensional arrays.

Pandas is Excel on steroids
Hamlet Batista
What is a Pandas DataFrame?
A Pandas DataFrame is a data structure that combines 1-dimensional arrays into two-dimensional structures with rows and columns that can contain different data types
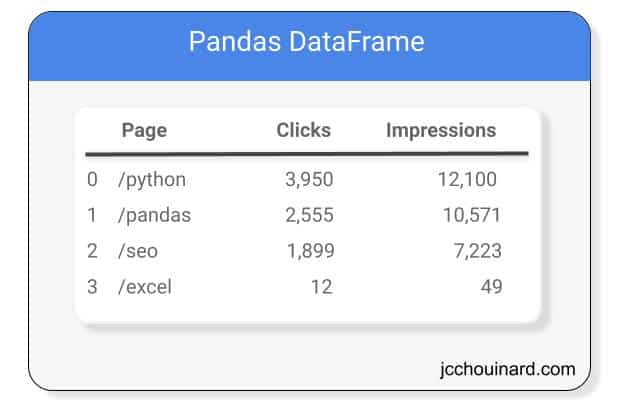
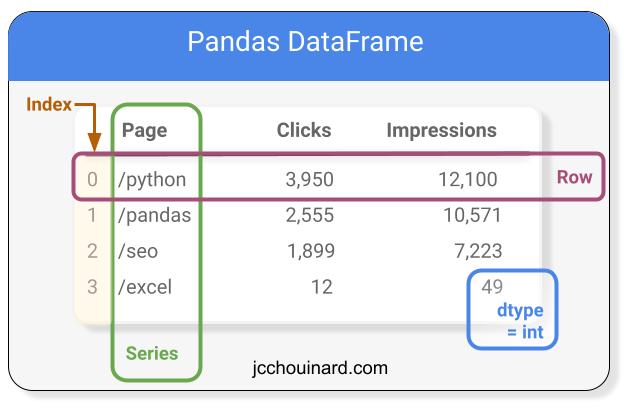
Basic Structure of a pandas DataFrame
A Pandas Dataframe contains columns, also called Series, rows, indexes, and also store the data types of the values.
How Pandas Can Replace Excel?
Excel is the worst. If you want to live a long and healthy life, drop it. Pandas is a much better alternative to Excel, especially if you work with large sets of data.
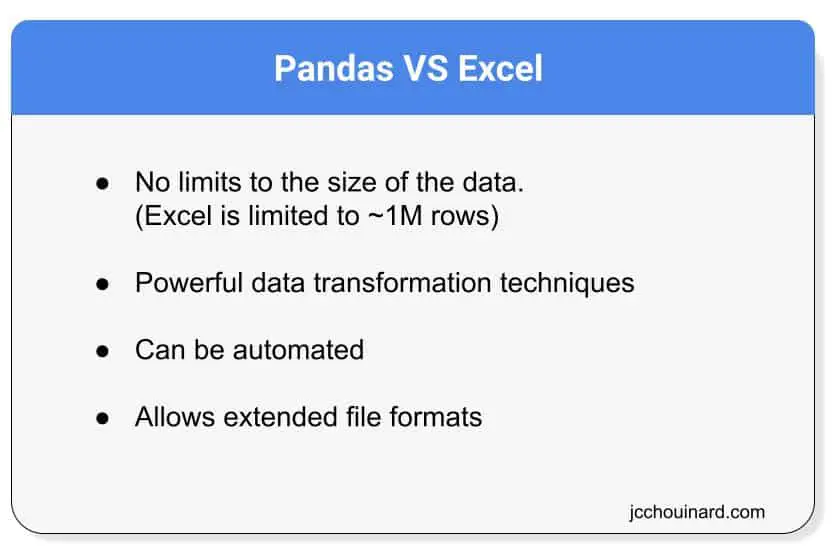
Excel does nothing that Python can’t do better. Let’s learn a little bit about Python Pandas.
If you drop Excel for Python (and I mean, never use Excel EVER), I guarantee you that you will never regret it.
It can be used for:
- Data validation
- Statistical analysis
- Data visualization
- Report
- Importing and saving data to multiple file formats (csv, sql, pkl, …)
Excel to Python: How to Use Excel With Python
These 18 Pandas functions will help you replace Excel with Pandas.
import pandas as pd
df = pd.read_excel('filename.xlsx') # Read Excel File
df.to_excel('filename.xlsx', index=False) # Save Excel File
pd.read_csv('filename.csv') # Read CSV File
df.to_csv('filename.csv') # Save CSV File
df.head() # Preview dataframe
df.count() # Count Rows
df.describe() # Get general statistics (min,max,mean,std,...)
df['col_name'] # Select one column
df['col_name'].value_counts() # Get unique value count
df.fillna(0) # Replace Null values
df.dropna() # Remove Null values
df[df['col_name'] == 0] # Filter DataFrame
df.drop_duplicates() # Remove duplicates
df.merge(df2,on='col_name') # vlookup
df.replace() # Find and replace
df.groupby(['col1','col2']).sum() # Pivot/Groupby
df.groupby(['col1','col2']).agg({'col1':'sum','col2','count'})
df.plot() # Plot your DataFrame
df = pd.util.testing.makeDataFrame() # or # pd.get_dummies(pd.Series(list('abcaa'))) # Create dummy dataframe
Import Package
The first step is to import the pandas package into your code.
import pandas as pd
Work With Excel Files (read_excel, to_excel)
To read and save to Excel files, use pandas.read_excel or pandas.to_excel.
import pandas as pd

df = pd.read_excel('filename.xlsx') # Read Excel File
df.to_excel('filename.xlsx', index=Fales) # Save Excel File
Work With CSV Files
import pandas as pd

pd.read_csv('filename.csv') # Read CSV File
df.to_csv('filename.csv') # Save CSV File
Create a DataFrame
With Arrays
import numpy as np
import pandas as pd

arr = np.array([
    [1,4], [2,5], [3,6]
    ])

pd.DataFrame(arr)

With Lists
import pandas as pd

ls = [
    ['a','d'], ['b','e'], ['c','f']
    ]

pd.DataFrame(ls)

With Dictionary
import pandas as pd

# Create lists for the data
# Each list will become a pd.Series
pages = ['/python', '/pandas', '/seo', '/excel']
clicks = [400, 300, 200, 100]

# Store lists into a dictionary
dictionary = {
    'pages':pages,
    'clicks':clicks
}

# Create the DataFrame
pd.DataFrame(dictionary)

Preview DataFrame
To preview your Dataframe, use the head() method.
df.head(2) # Preview first 2 rows of dataframe

Get Statistics
df.count() # Count Rows
df.describe() # Get general statistics (min,max,mean,std,...)
df['col_name'].value_counts() # Get unique value count
Work with DataFrame
df['col_name'] # Select one column
df.fillna(0) # Replace Null values
df.dropna() # Remove Null values
df[df['col_name'] == 0] # Filter DataFrame
df.drop_duplicates() # Remove duplicates
Replace Vlookup With Pandas merge
To replace vlookup using pandas, use the pandas.DataFrame.merge method.
df.merge(df2, on='col_name') # vlookup
Both Data frames will need to have a common “key”. In the example above, both df and df2 should have a column named “col_name“.
Pandas .replace() vs Excel Find and Replace
Pandas .replace() method is far more efficient than Excel’s search and replace or substitute functionalities.
df.replace('to_replace', 'new_value) # Find and Replace
df.replace(regex=r'^ba.$', value='new') # Allows regex
Replace Pivot Tables with GroupBy
df.groupby(['col1','col2']).sum() # Pivot/Groupby
df.groupby(['col1','col2']).agg({'col1':'sum','col2','count'})
Plot Your DataFrame
import pandas as pd
from pandas.util.testing import makeDataFrame
import matplotlib.pyplot as plt

# Make Dummy dataframe
df = makeDataFrame()

# Plot histogram
df['A'].hist()
plt.show()

# Plot a bar plot
g_df = df.groupby('A')['B'].mean()
g_df.plot(kind='bar')

# Scatter plot in Pandas
df.plot(x='A', y='B', kind='scatter')
plt.show()

# Customize plot
df.plot(
    x='A',
    y='B',
    kind='scatter',
    color='red',
    marker='D',
    title='Scatter Plot',
    xlabel='X-axis',
    ylabel='Y-axis'
    )
plt.show()
Interesting Applications of Python’s Pandas
If you are interested in going further, you can read about the other important Python libraries for Data Science, or learn by doing projects with Pandas:
Conclusion
This is it for the introduction to Pandas in Python.
You can now replace Excel with Python and never look back. If you are hooked, try 30 days of Pandas.

SEO Strategist at Tripadvisor, ex- Seek (Melbourne, Australia). Specialized in technical SEO. Writer in Python, Information Retrieval, SEO and machine learning. Guest author at SearchEngineJournal, SearchEngineLand and OnCrawl.