You were asked by your boss to gather monthly pageviews from 2015-2018 on a website that have 5 million page views per month. When you do, you get this annoying message from Google Analytics:
“Resource is not available. Please try again later.”
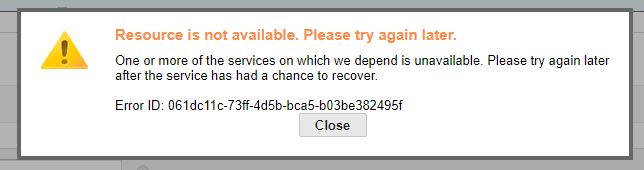
What happened?
Here is the truth, you’ve reached the maximum capacity of Google Analytics. The more you’ll work on a website with a massive amount of data, the more you’ll be faced with tools that can’t process your data.
Fortunately, there is a simple fix to that…
Create a dashboard with your data in Google Data Studio.
How to import Google Analytics Data in Google Data Studio?
Let’s take our example. I need to know how many page views I’ve had on a month-to-month basis since 2015.
1. Connect to Google Data Studio
Connect Google Data Studio with the same email you use to connect to your Google Analytics Account.
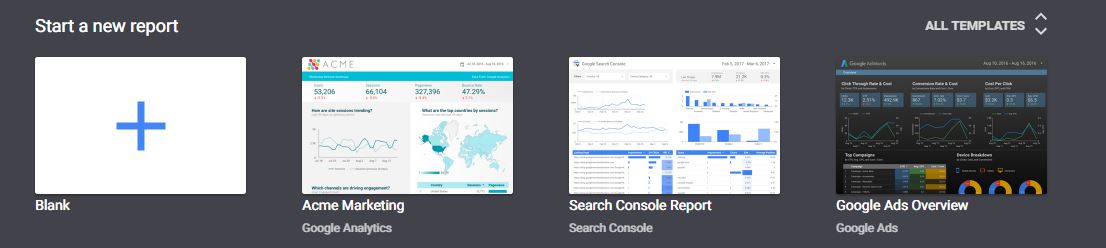
Start a Blank report.
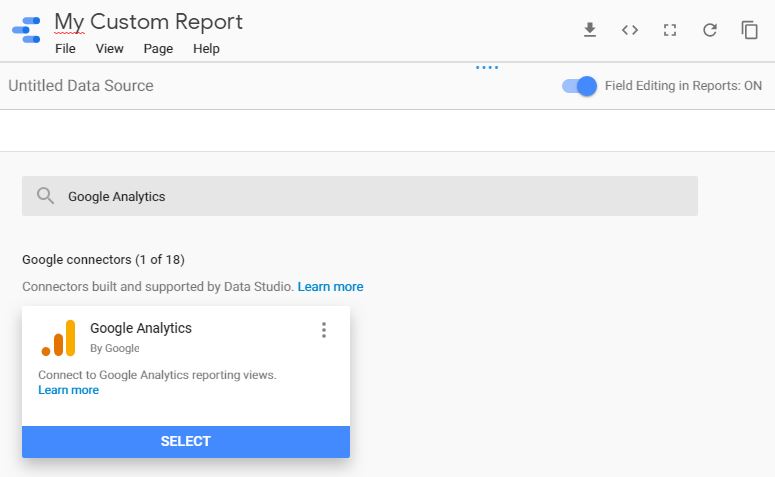
2. Create Your Data Source
On the right panel, select “Create New Data Source” and use Google connectors to connect to Google Analytics.
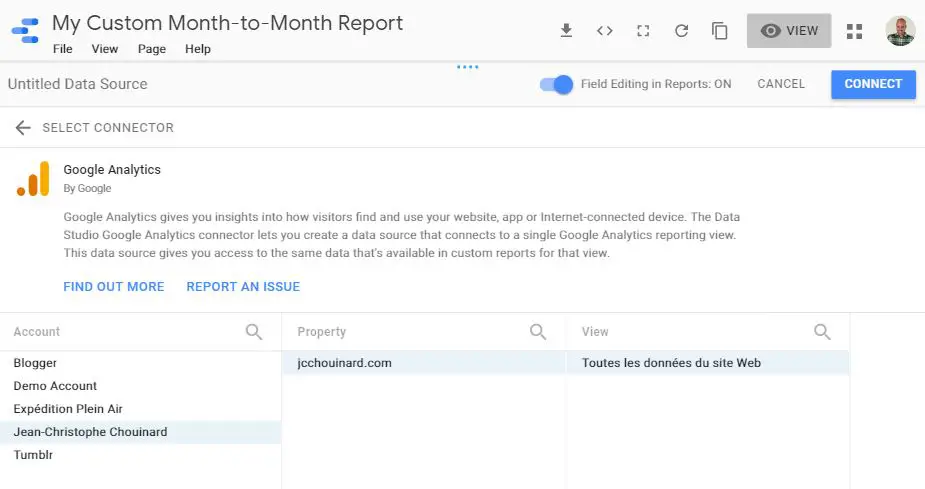
Then, you can authorize, choose your Google Analytics Account, click on “Connect” and then “Add to report”.
3. Create a pivot table with all Your Data
Here, what you want to do is create a time series to see your data month-to-month.
- Select Insert > Time Series
- Then, you’ll modify “Time Dimension” to “Month of Year”
- Change “Metrics” to “Page Views”
- Set “Default Date Range”
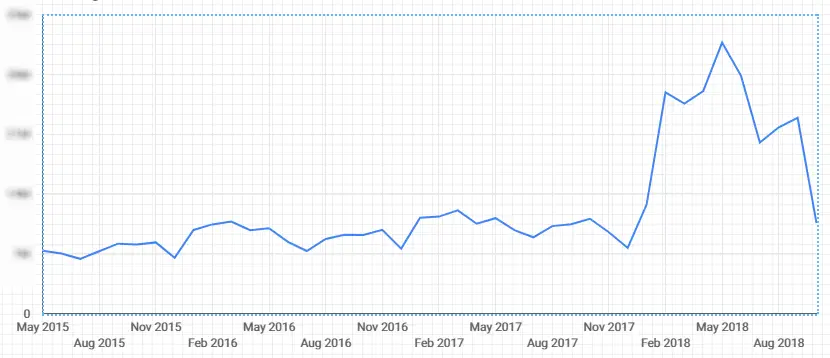
Here you go you have all data that you couldn’t get with Google Analytics.
But wait a minute… what’s that big increase?
We’ll see on the next blog post, I’ll show you how to investigate your Data with Google Analytics.
Looking for a Introduction Guide to Google Analytics? Here is a great Guide on how to install Google Analytics using Google Tag Manager.

SEO Strategist at Tripadvisor, ex- Seek (Melbourne, Australia). Specialized in technical SEO. Writer in Python, Information Retrieval, SEO and machine learning. Guest author at SearchEngineJournal, SearchEngineLand and OnCrawl.